Observability Architecture
How the pieces fit together before you configure any of them. Monitoring and Logging each follow a layered architecture, and how you collect application metrics depends on where the workload runs.
Cloud Monitoring architecture
A Cloud Monitoring deployment has three layers - signals flow from metric collection, through metric storage (the Cloud Monitoring API), to visualization and analysis:
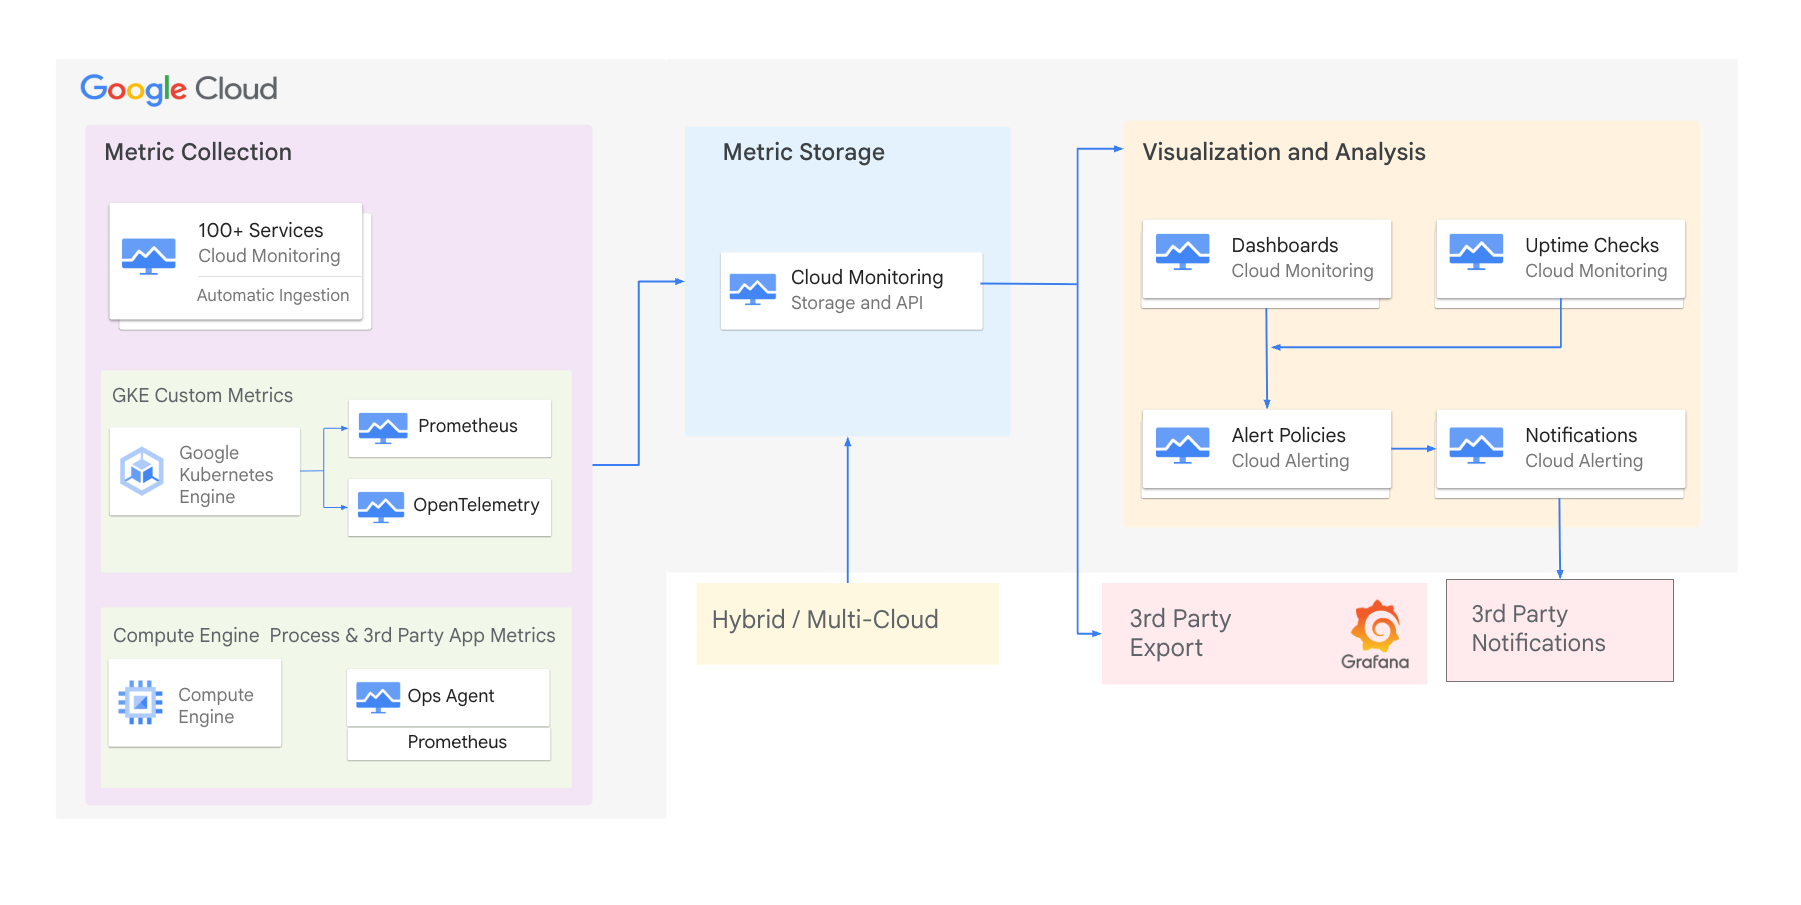
Platform monitoring (default, free)
Platform monitoring is blackbox visibility into your Google Cloud services, and it is on by default - system metrics are collected with no effort on your part.
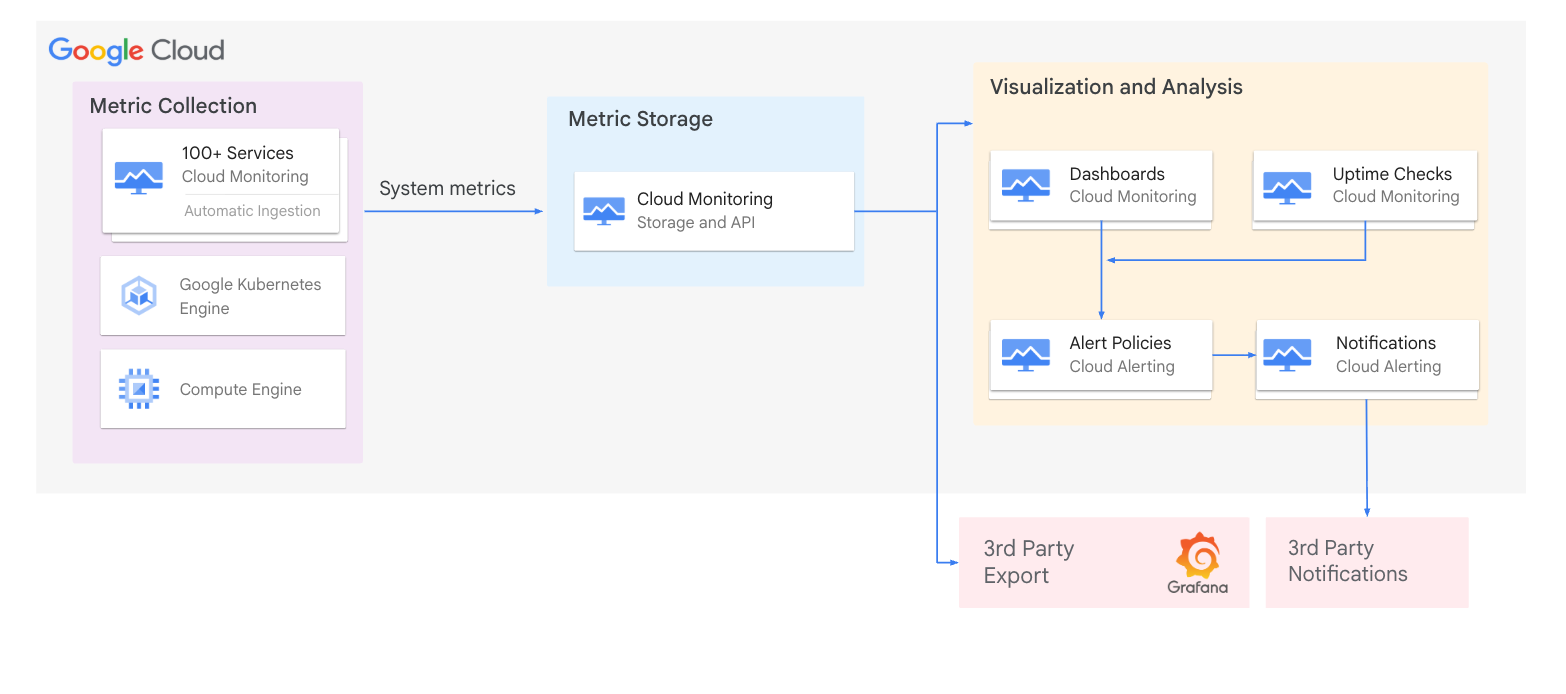
- Over 1,500 metrics across more than 100 Google Cloud services, at no cost.
- Compute Engine alone reports 25+ metrics per VM instance.
- To pull these into a third-party monitoring product, ingest them through the Cloud Monitoring API.
Application monitoring on GKE
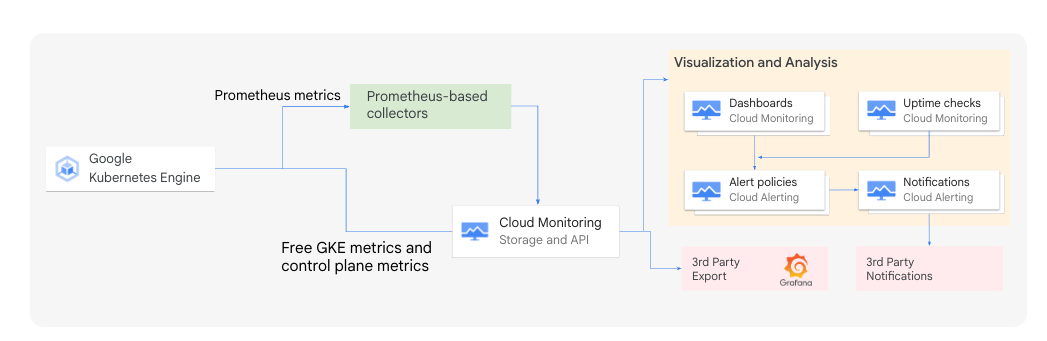
For workloads on GKE, use a Prometheus-based approach via Google Managed Service for Prometheus (GMP) - part of Cloud Monitoring. It ingests data in Prometheus format, supports PromQL, and includes the Prometheus expression browser and rule evaluation, so GKE cluster and workload metrics show up as Prometheus data.
Application monitoring on Compute Engine
For Compute Engine VMs, the Ops Agent collects in-process and third-party application metrics (30+ plugins, built on OpenTelemetry) and ships them through the Cloud Monitoring API.
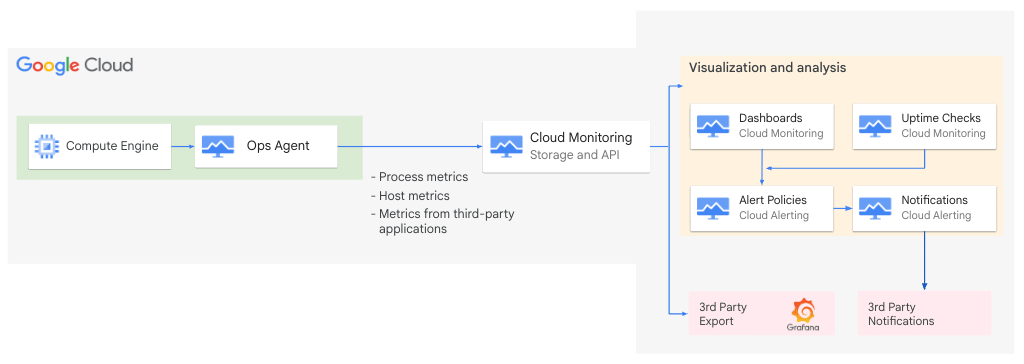
The Cloud Monitoring page has the same path drawn as a hand-authored diagram, plus the guest-metrics gotcha (memory and disk space need the agent).
Hybrid and multi-cloud
To bring metrics and logs from on-premises VMs and other clouds (AWS, Azure, and others) into Google Cloud, use Blue Medora's BindPlane. BindPlane metrics arrive as custom metrics (chargeable), and its logs are billed like other Cloud Logging logs.
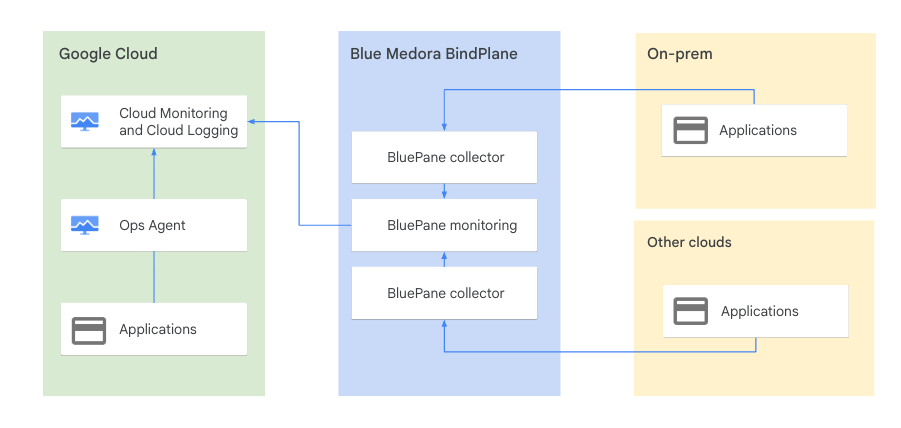
The Partner integrations page has the full BindPlane reference architecture as a hand-authored diagram.