Cloud Logging
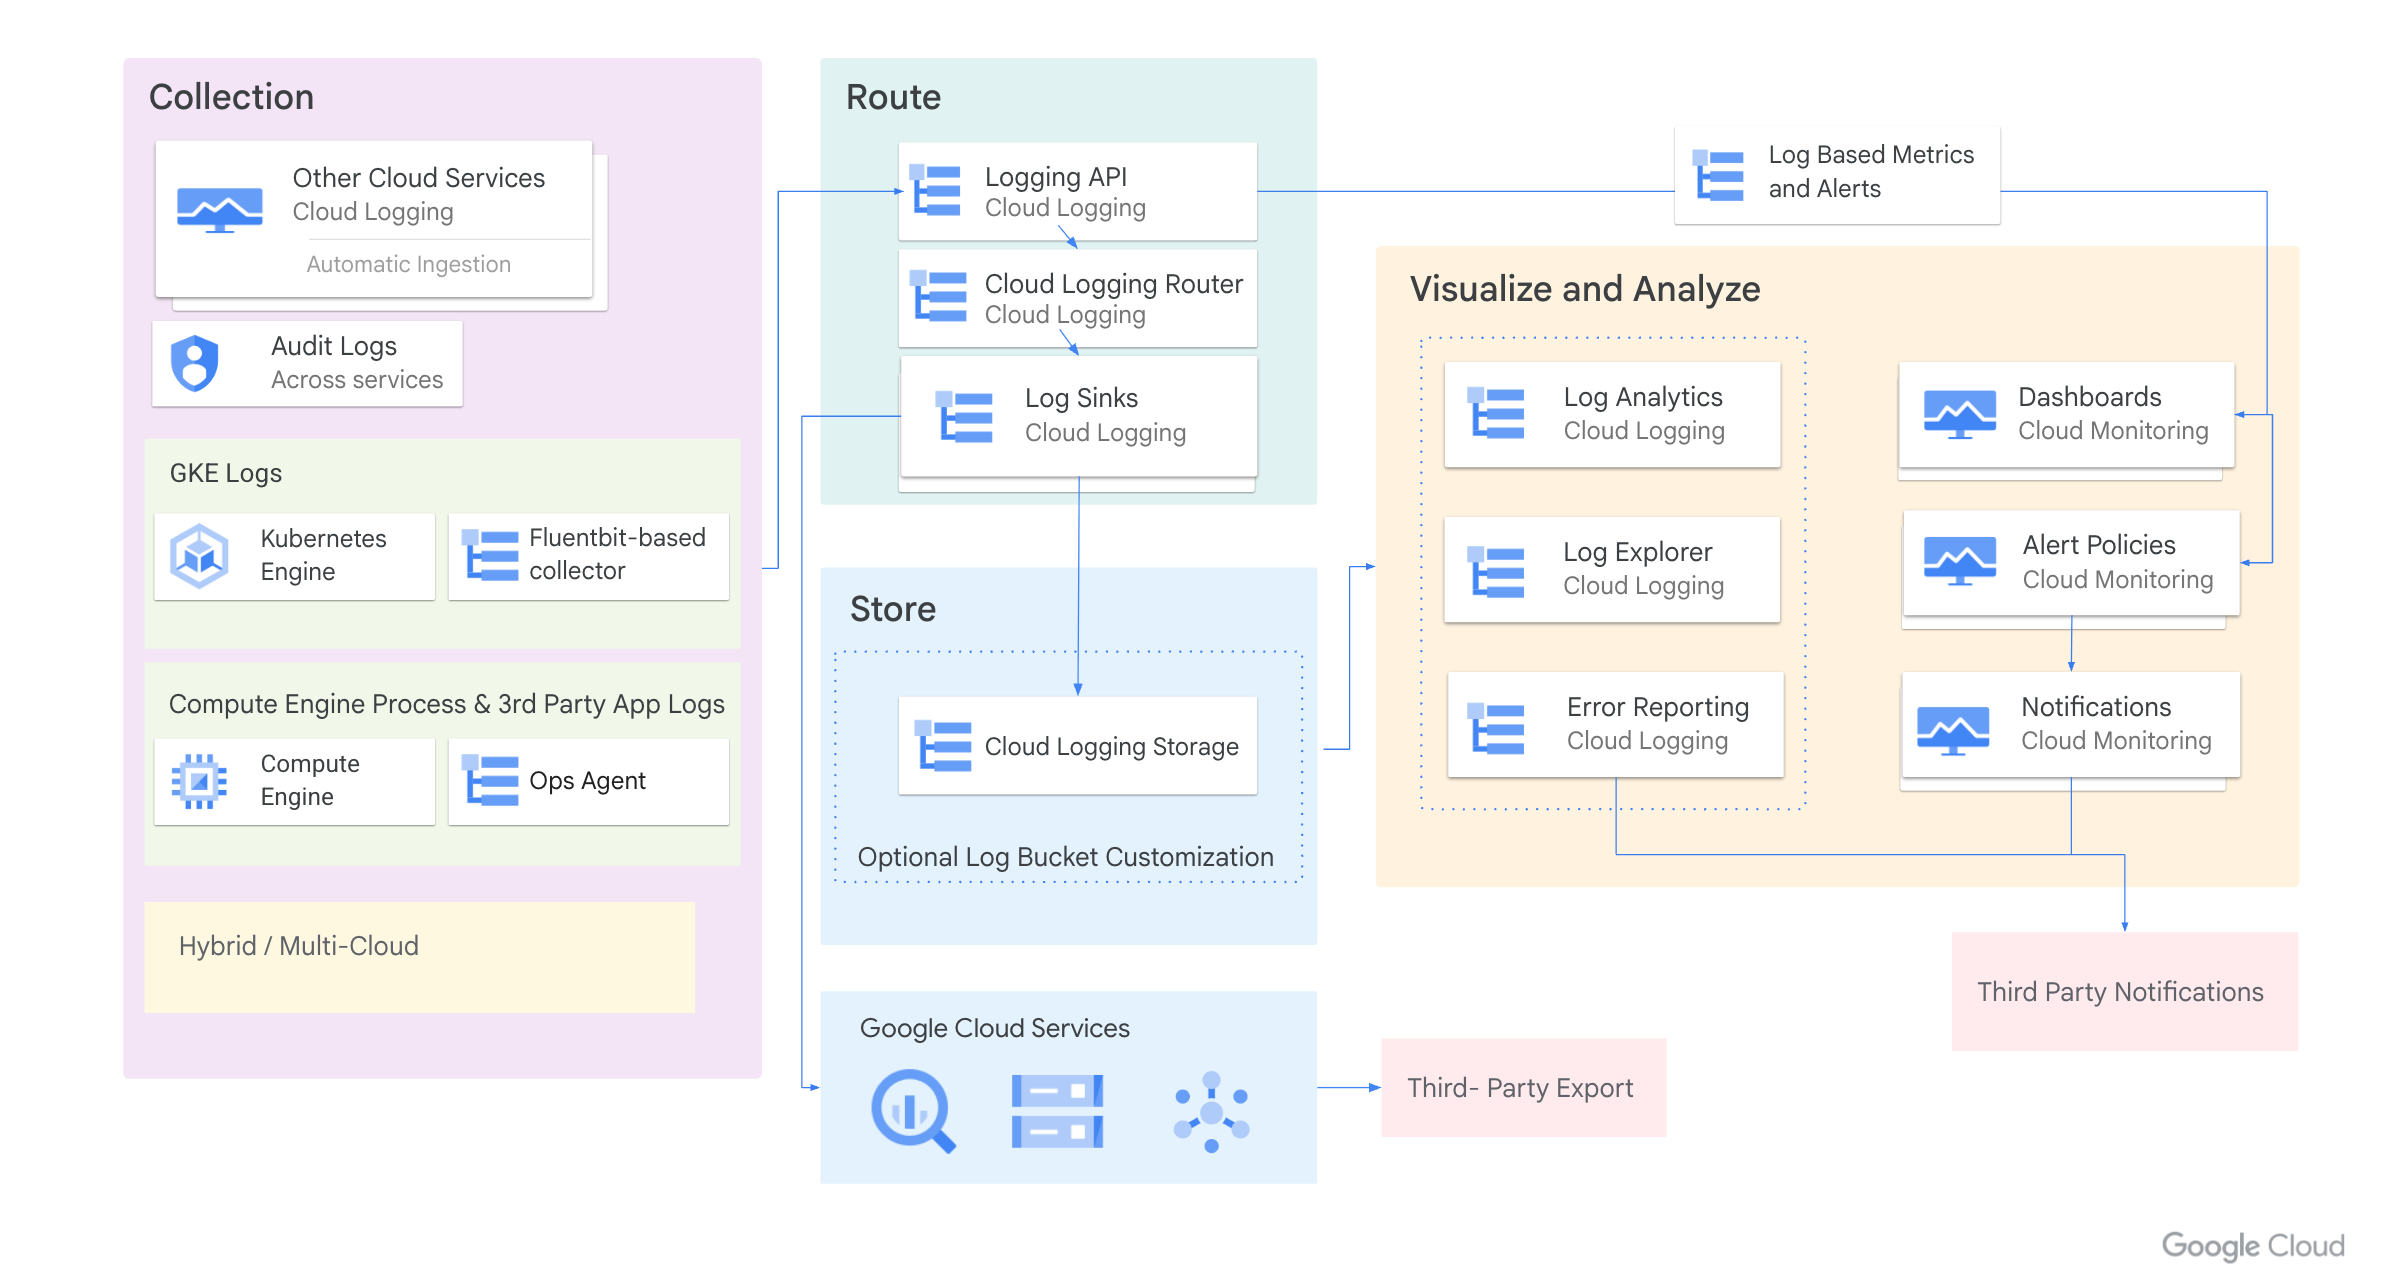
Cloud Logging is a fully managed service that stores, searches, analyzes, monitors, and alerts on log data - ingesting application and system logs from thousands of VMs across Google Cloud and AWS. Logs flow into the Log Router, which decides where each entry goes based on sinks. Every entry hits the router first, then lands in one or more log buckets and/or is exported out. You read entries in the Logs Explorer with filter queries.
Log types
Which logs you see depends on which resources you use. The key categories:
Security logs are covered in depth on the Audit Logs page.
Collecting logs
You send app logs with client libraries, a logging agent, gcloud logging write, or the
entries.write API endpoint. How automatic collection works depends on the platform:
Logs Explorer and filters
The Logs Explorer interface has six regions: an action toolbar (refine scope, share, learn), the query pane (build LQL, plus Recent / Saved / Suggested queries), a results toolbar (create metric/alert, jump to now), the Log fields panel (counts per field for fast refinement), the Histogram (log volume over time, color-coded by severity), and the query results list. Ultimately it is the query that selects the entries.
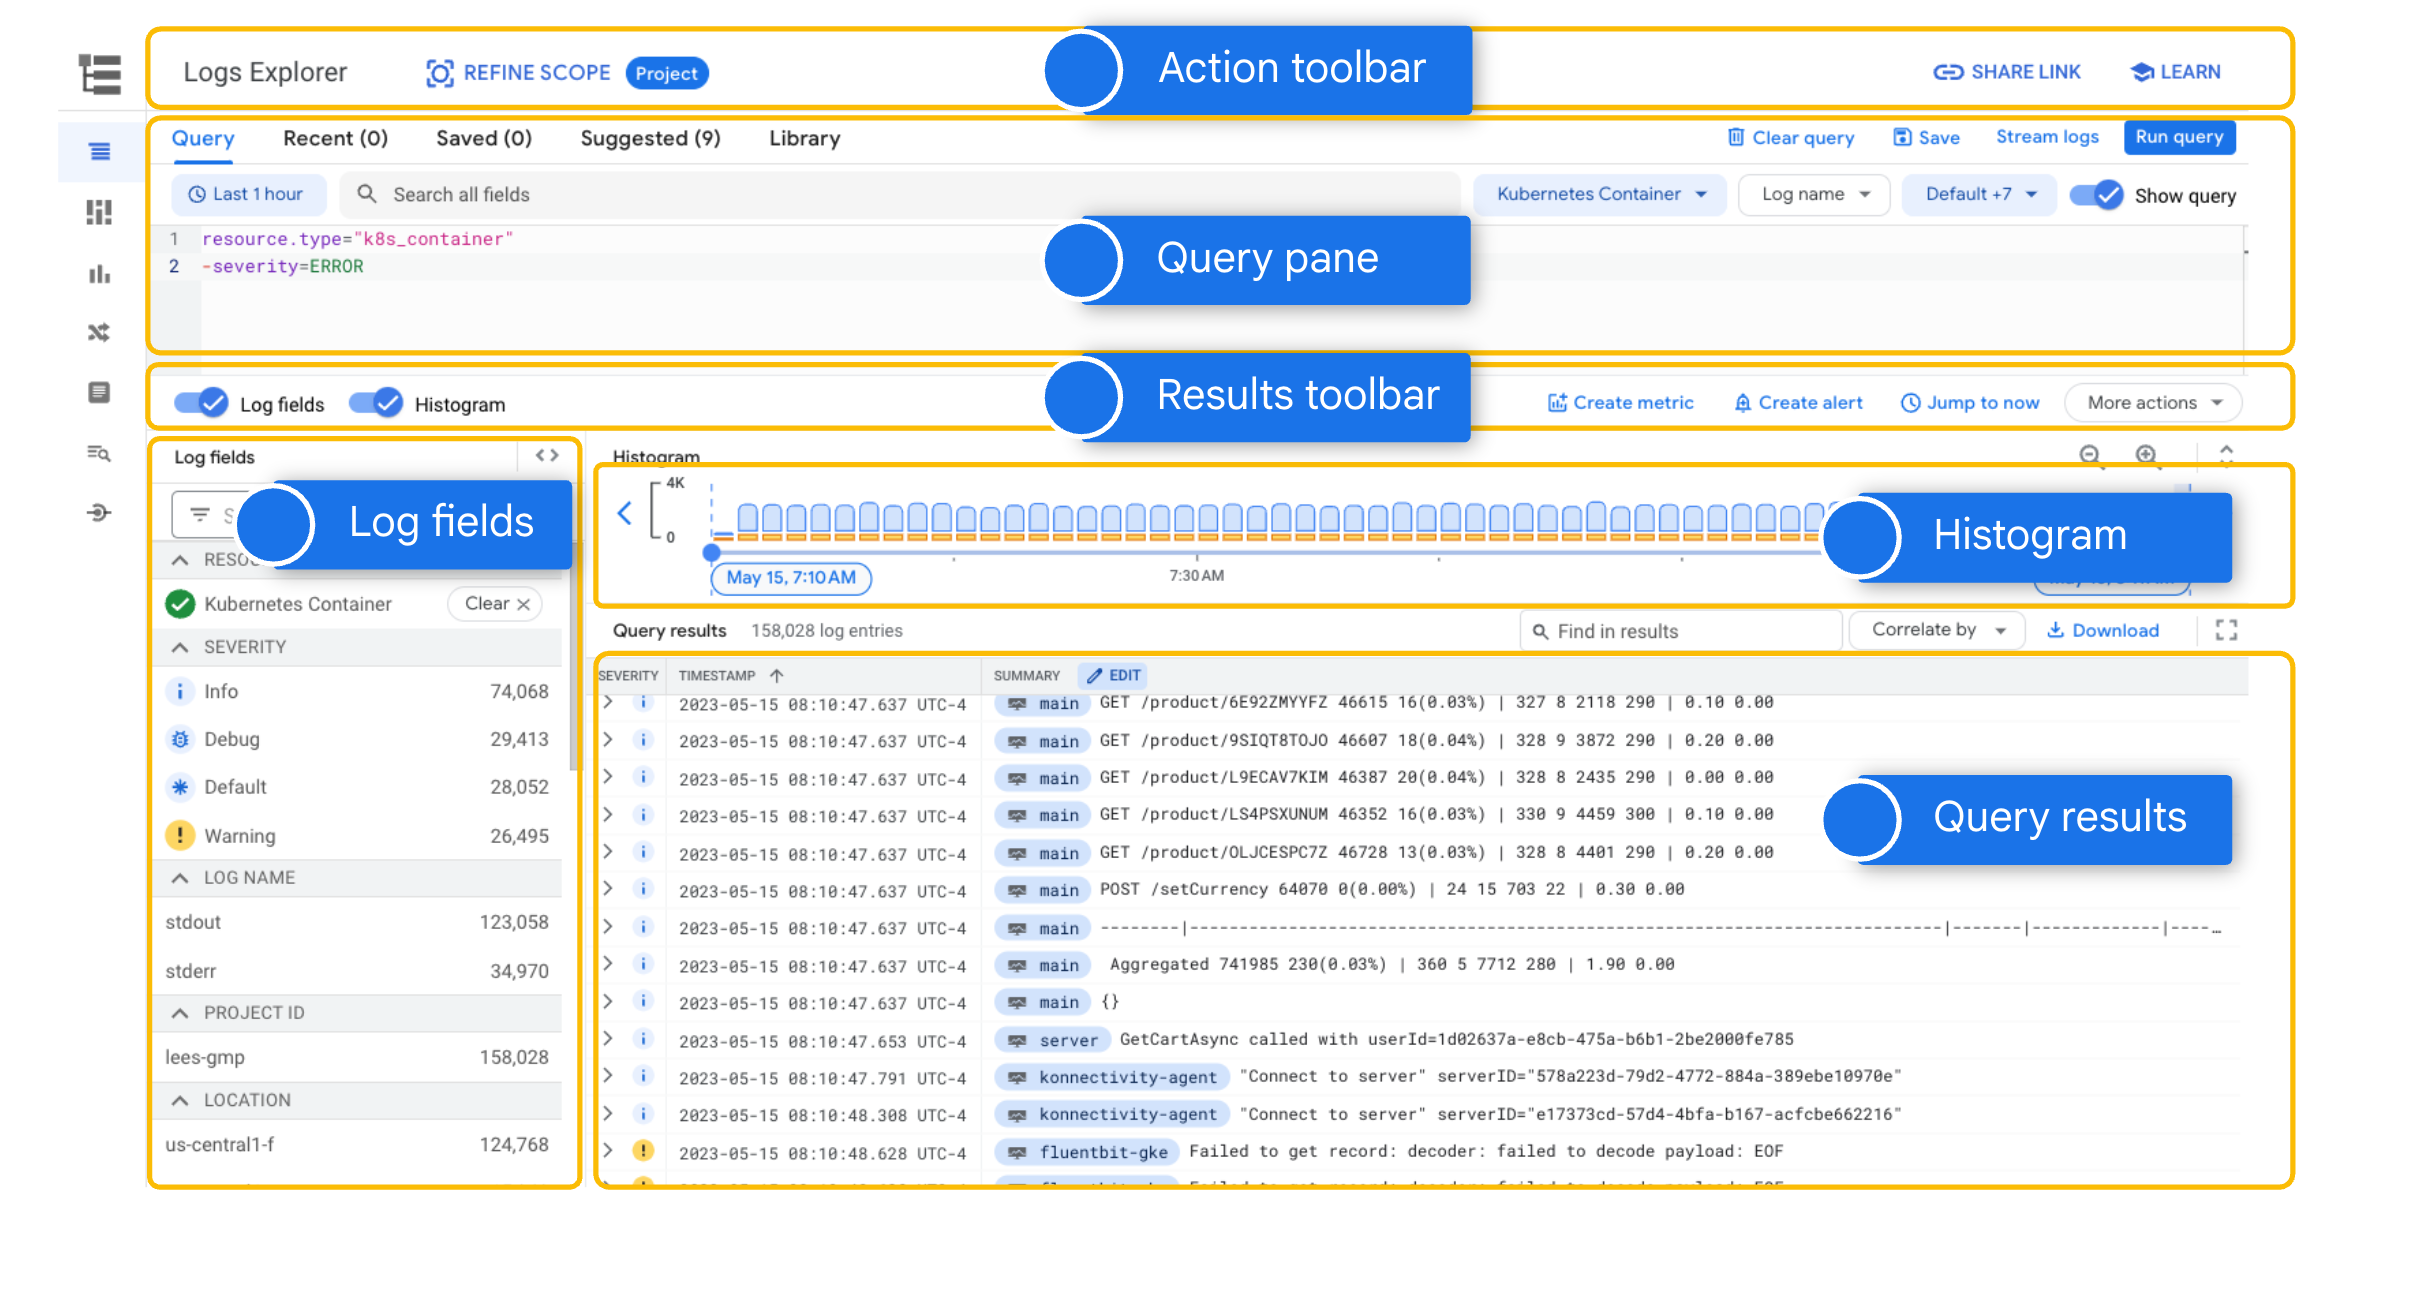
The Logs Explorer uses the Logging query language (LQL): filter by resource.type,
severity, logName, labels, and free text. Severities: DEFAULT < DEBUG < INFO < NOTICE
< WARNING < ERROR < CRITICAL < ALERT < EMERGENCY.
Build the query with the drop-down menus, the Log fields panel, or by clicking a field in a result. The drop-downs combine selections differently depending on the field:
- Resource (
resource.type) - one at a time; multiple entries are joined with AND. - Log name (
logName) - multiple at once, joined with OR. - Severity (
severity) - multiple at once, joined with OR.
=and!=- match / not-match a field value (find a specific resource type or id).><>=<=- numeric ordering, handy ontimestampor duration fields.:- "has" / substring match within a field.:*- test that a field exists (is present or defaulted) without matching a value.
AND, OR, NOT must be written in all caps. Precedence is NOT > OR > AND (not the
usual AND-before-OR), and AND/OR are short-circuit operators - parenthesize when in doubt.
Prefer the built-in SEARCH() function over a raw global or substring search - it is more
efficient. SEARCH([query]) scans the whole entry; SEARCH([field], [query]) scans one field.
It only matches text fields, so it can't search non-text fields.
- Search indexed fields -
logName,resource.type,resource.labels- these are preferentially indexed and make the biggest difference. - Name the log(s) you want explicitly rather than doing a full-text scan (full-text is slow).
- Restrict the time range to shrink the data scanned.
Log buckets
Storage lives in log buckets. Two exist automatically in every project:
- _Required bucket - Admin Activity + System Event audit logs, 400 days, fixed, free, cannot be deleted or changed.
- _Default bucket - everything else, 30 days default retention (configurable up to 3650 days / 10 years).
Log Router and sinks
Every entry hits the Log Router first, which uses inclusion and exclusion filters on its sinks to decide where each entry goes - one or more log buckets and/or exported destinations.
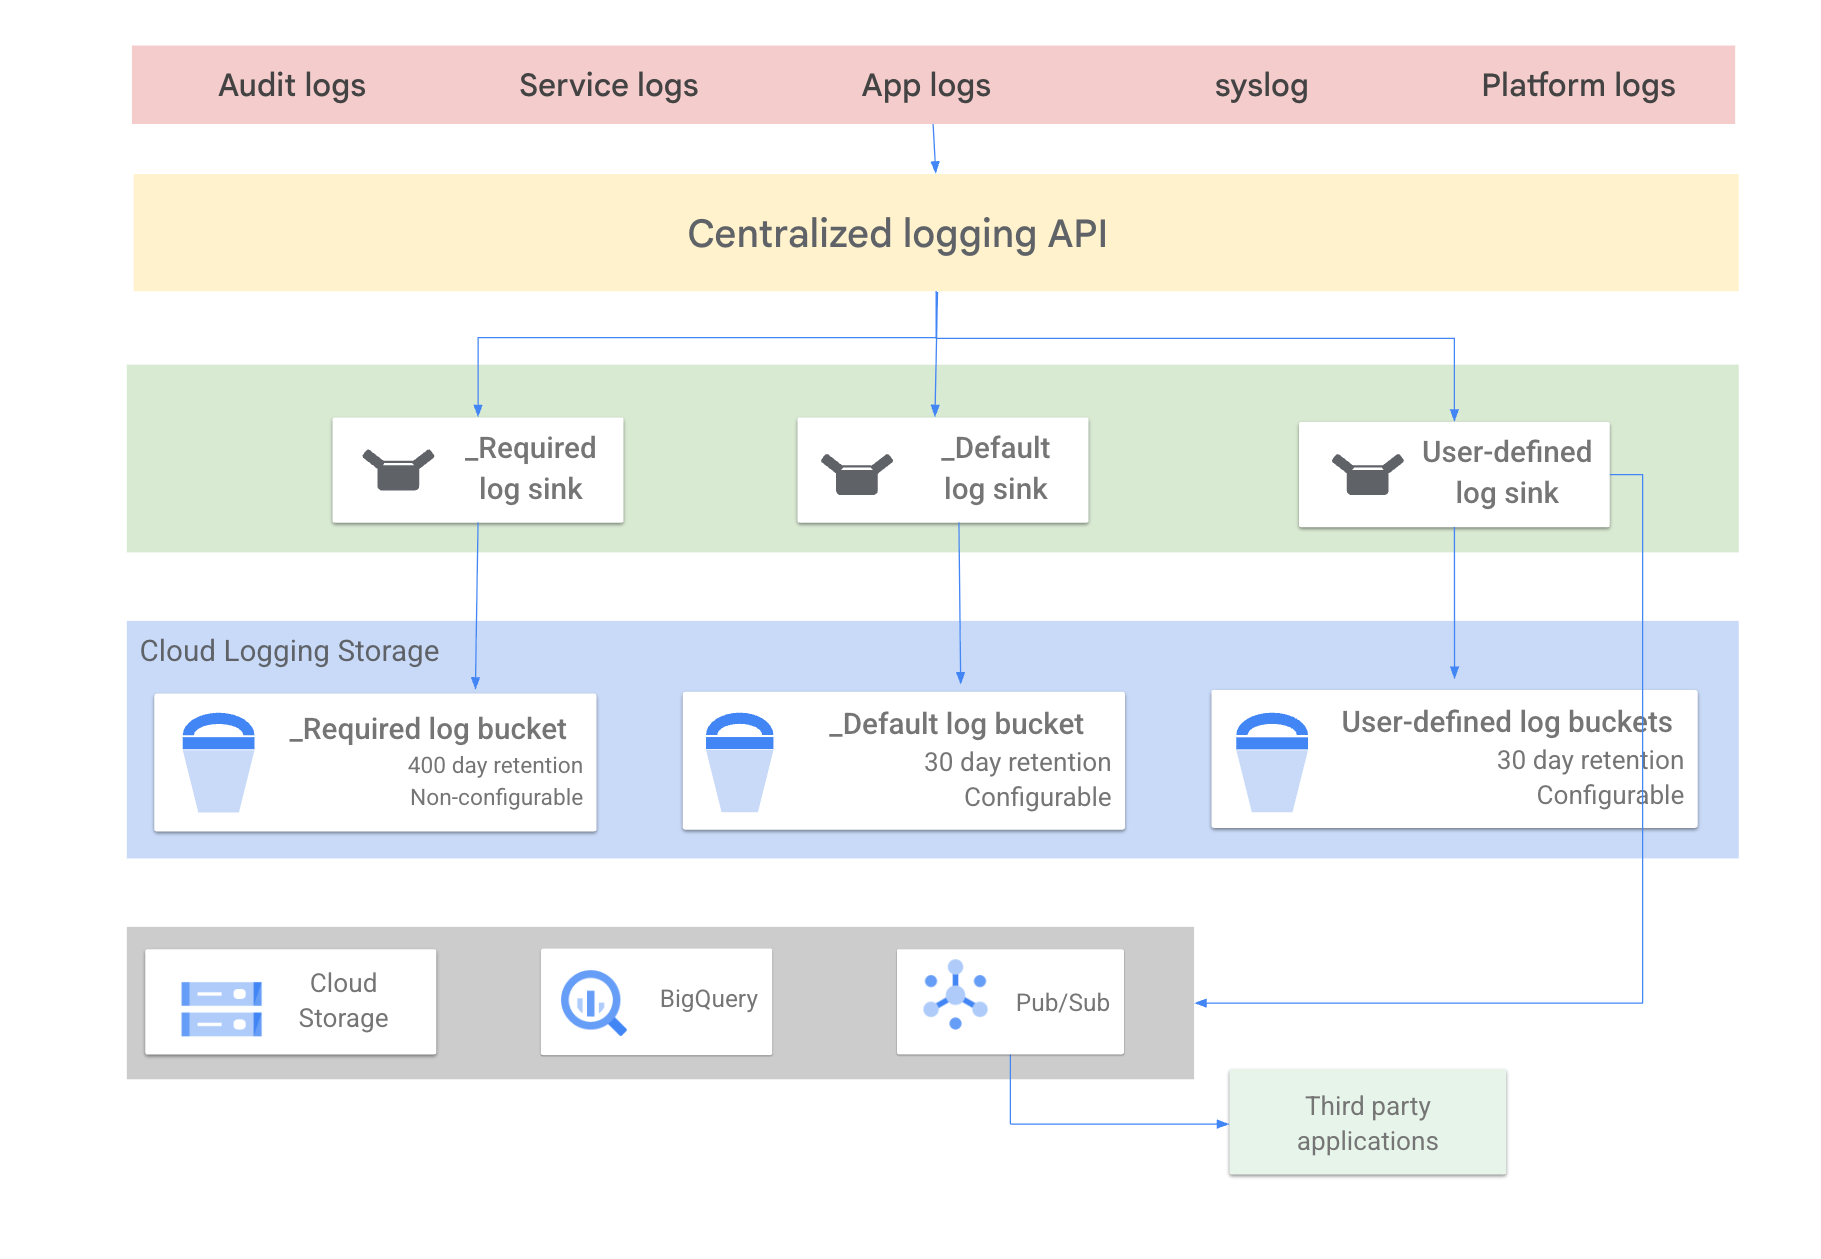
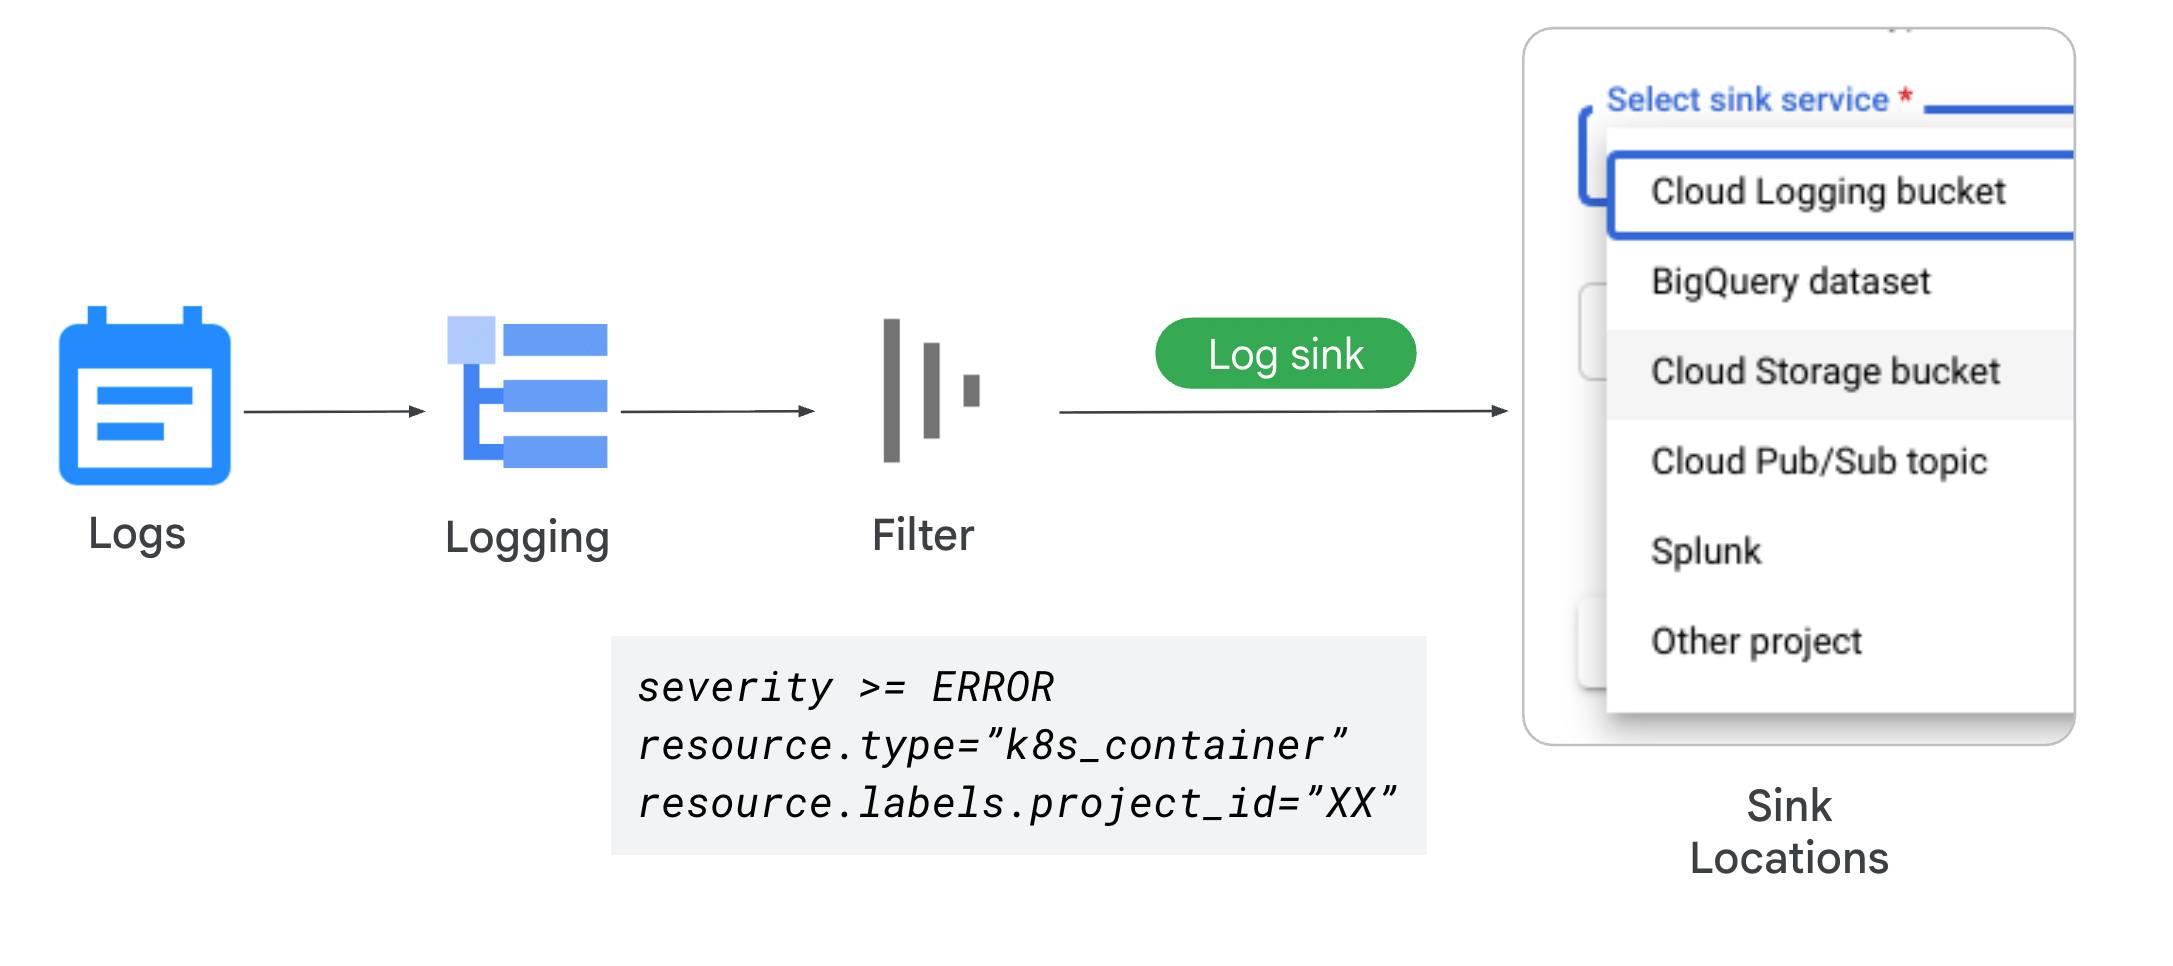
A sink = an inclusion filter + a destination. This is how you route or export logs. You can also add exclusion filters to drop noisy logs before they're stored (saves cost).
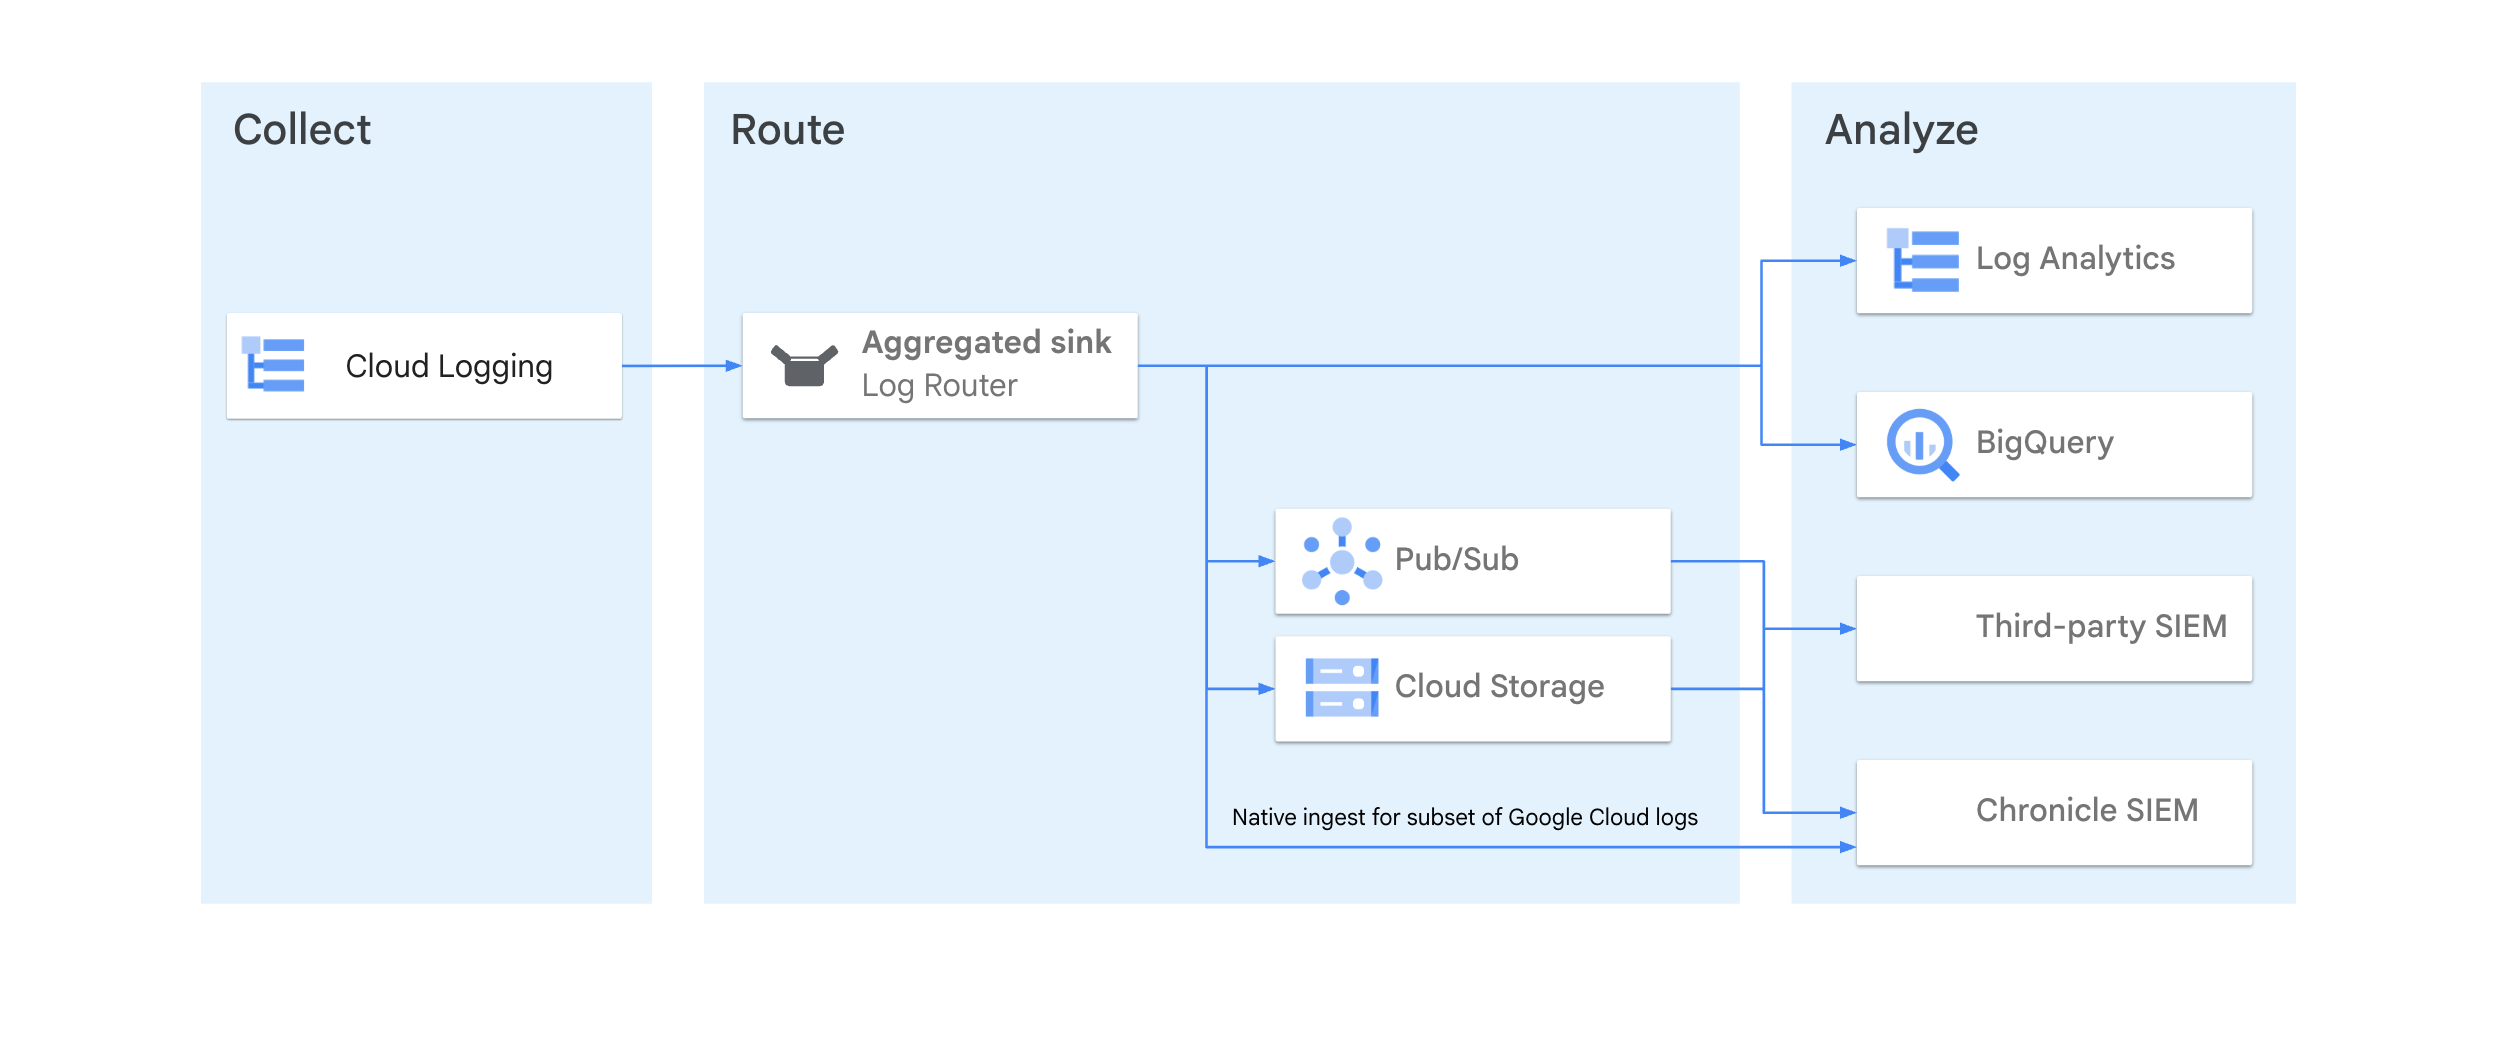
To capture logs from every project in a folder or org into one destination, create an aggregated sink at the org, folder, or billing-account level. A per-project sink only catches that one project. Also: the sink's writer service account needs write permission on the destination or exports silently fail.
For security analytics, a common sink destination is Chronicle (Google's SIEM), joining Splunk and Pub/Sub-fed third-party SIEMs as the place aggregated security logs are streamed for threat detection.
Analyze exported logs
Logs are only retained for 30 days in the _Default bucket, so exporting is how you
both keep them longer and do real analysis. Match the destination to the goal: Cloud
Storage for cheap long-term archive, BigQuery to run fast SQL over the data, and
Pub/Sub to stream entries to external apps or endpoints. Once logs land in a BigQuery
dataset, connect the tables to Looker Studio to turn raw entries into reports and
dashboards.
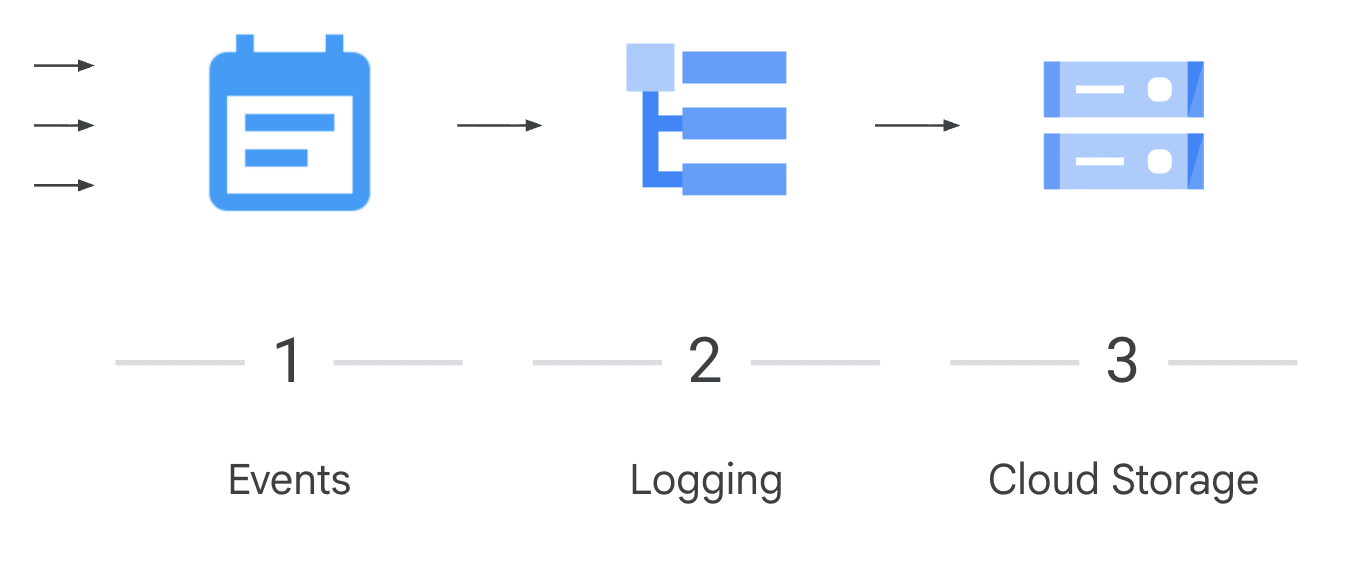
The simplest export path, end to end - events land in Logging and a sink writes matching entries straight to a Cloud Storage bucket for cheap long-term archive:
- Forecast capacity - query network-traffic logs to understand traffic growth over time.
- Optimize spend - find your heaviest flows and cut network egress costs.
- Network forensics - identify the top IP addresses talking to a server; relocate infrastructure or deny hostile IPs.
- Looker Studio turns the BigQuery tables into shareable reports and dashboards - no SQL needed for viewers.
LogEntry-type fields keep their exact names, but user-supplied and structured-payload
fields (without an @type) are normalized to lowercase in the BigQuery schema. So
jsonPayload.MESSAGE becomes jsonpayload.message - write your SQL against the lowercase form.
| Log entry field | LogEntry type mapping | BigQuery field name |
|---|---|---|
| insertId | insertId | insertId |
| textPayload | textPayload | textPayload |
| httpRequest.status | httpRequest.status | httpRequest.status |
| httpRequest.requestMethod.GET | httpRequest.requestMethod.[ABC] | httpRequest.requestMethod.get |
| resource.labels.moduleid | resource.labels.[ABC] | resource.labels.moduleid |
| jsonPayload.MESSAGE | jsonPayload.[ABC] | jsonPayload.message |
| jsonPayload.myField.mySubfield | jsonPayload.[ABC].[XYZ] | jsonPayload.myfield.mysubfield |
Streaming export in near real time
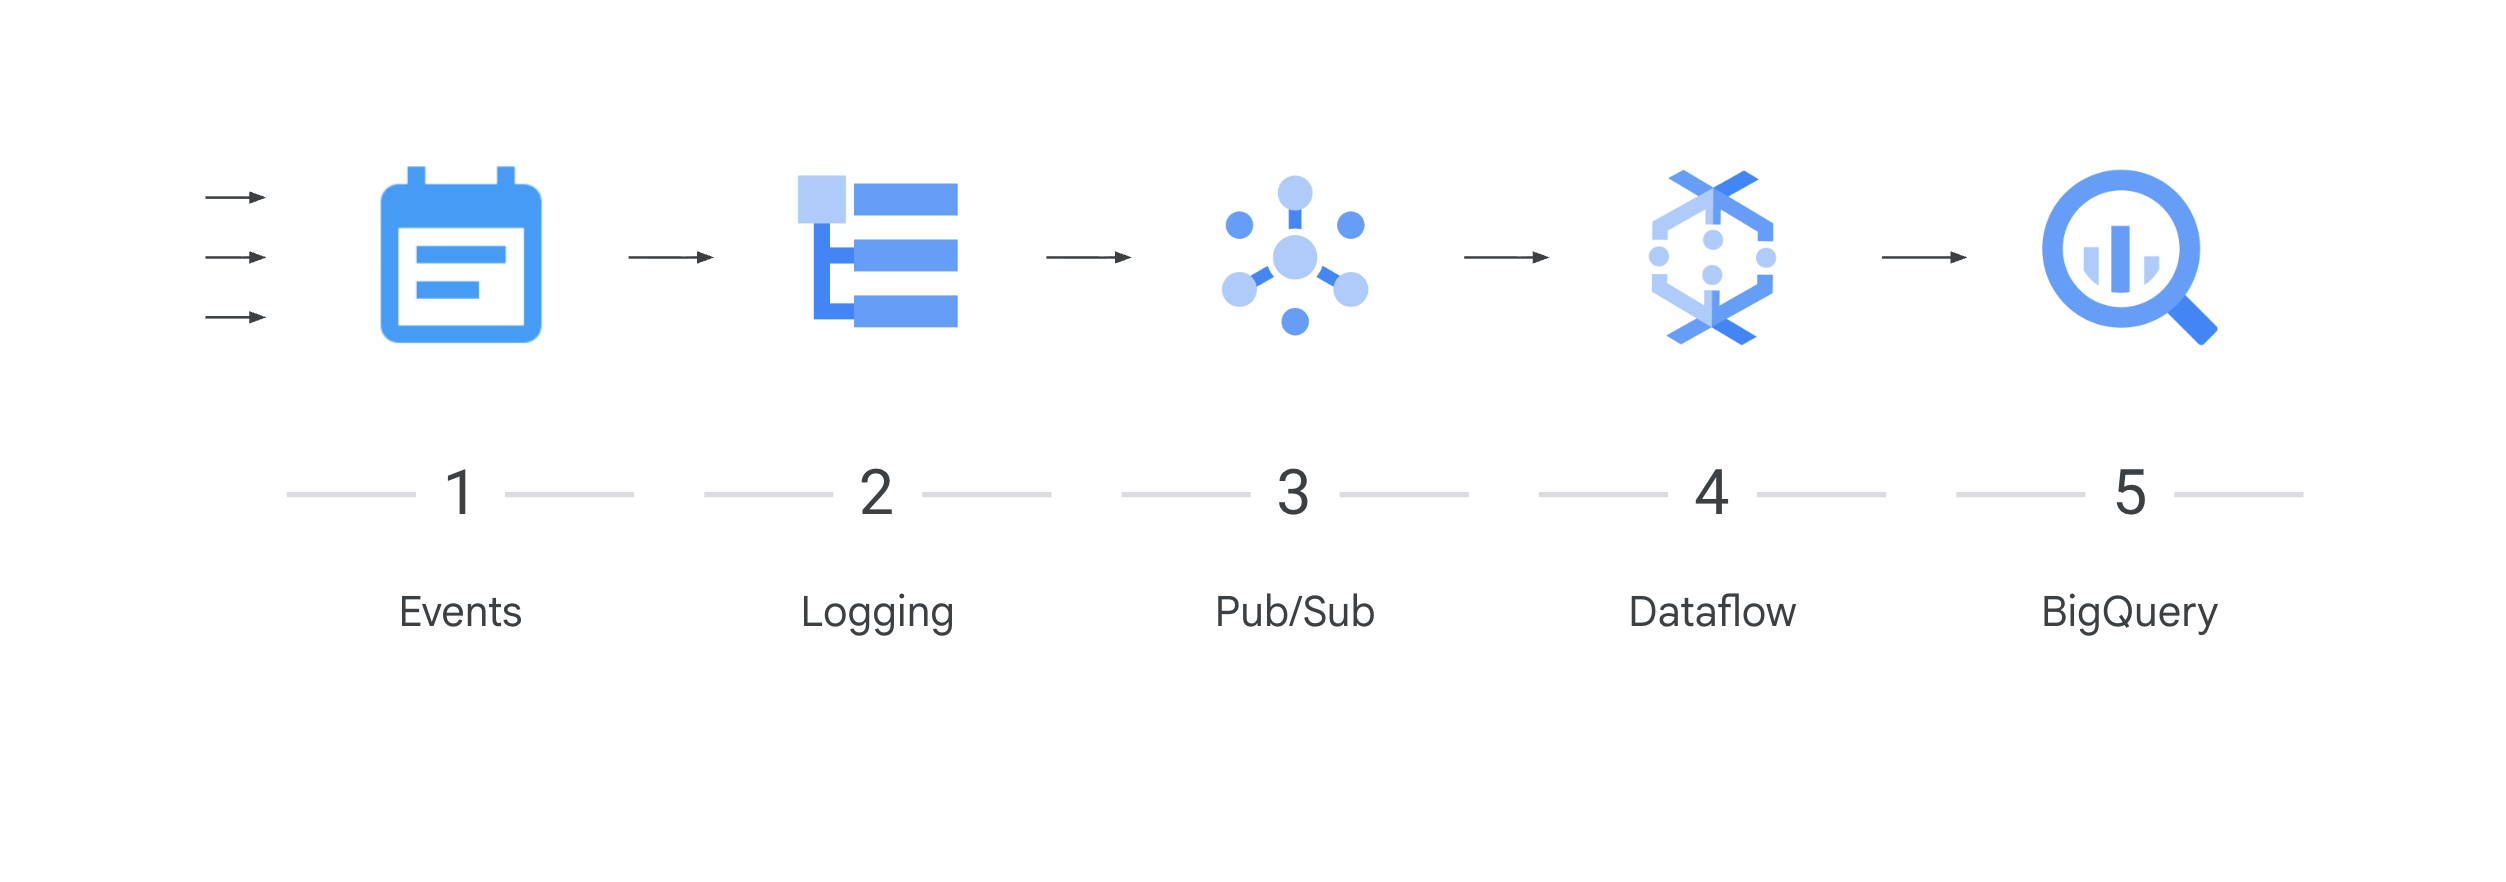
The sink-to-BigQuery path above is a periodic batch export. When you need logs queryable seconds after they happen, stream them instead: route to a Pub/Sub topic, run a Dataflow pipeline that transforms and loads the stream, and land it in BigQuery.
Log-based metrics
Log-based metrics derive Cloud Monitoring metrics from the content of log entries - for example, count entries containing a specific message, or extract a latency value. They become time series you can use in Monitoring charts and alerting policies. This is the bridge from logs to monitoring/alerting.
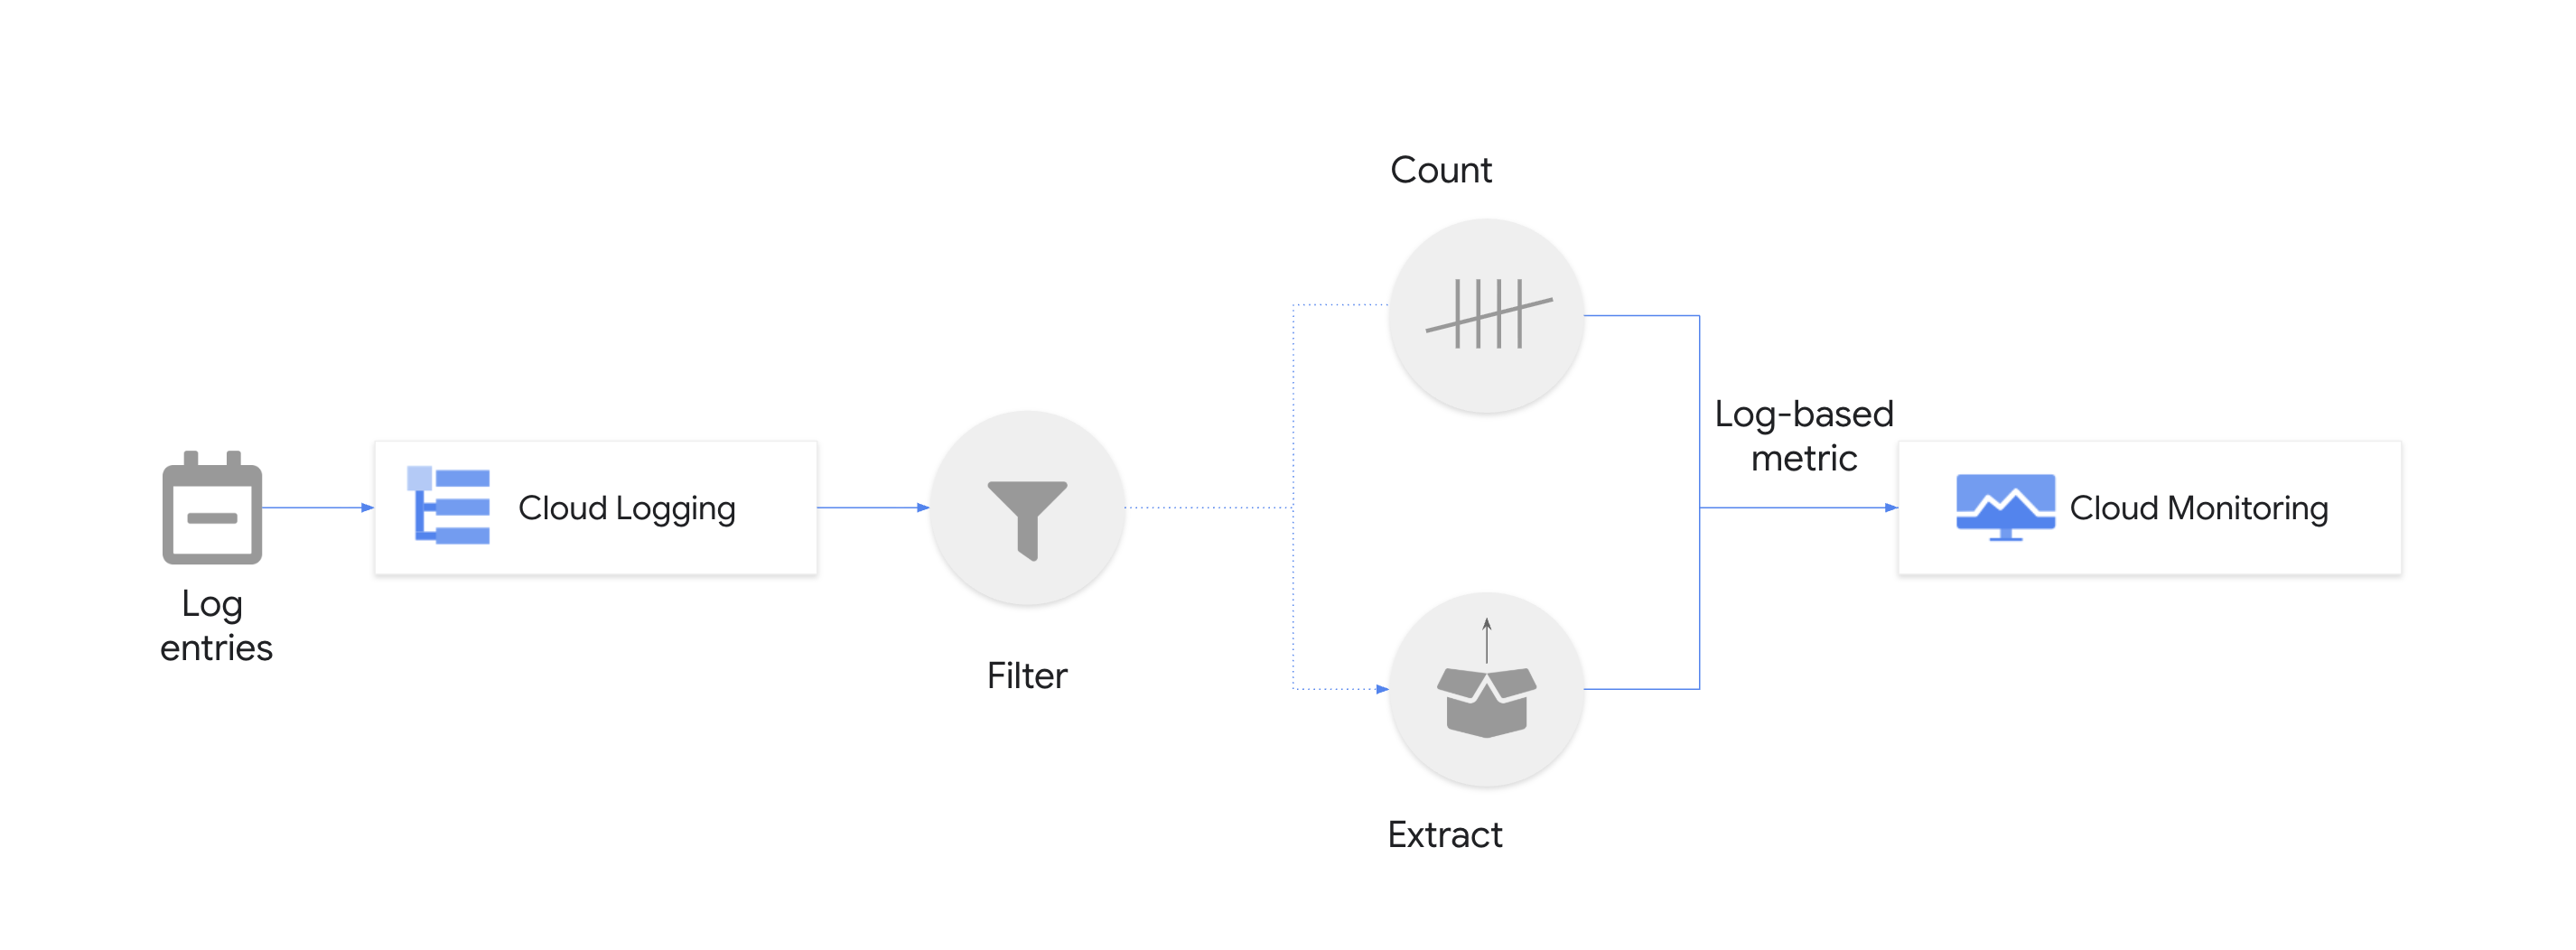
- System-defined - provided by Cloud Logging, available to all projects, all of the counter type. Calculated only from logs actually ingested (excluded logs don't count).
- User-defined - you create them for what matters to you; can be counter, distribution, or boolean.
- Counter - counts log entries matching a query.
- Distribution - records the statistical distribution of an extracted numeric value in histogram buckets (count, mean, sum of squared deviations).
- Boolean - records whether an entry matched the filter.
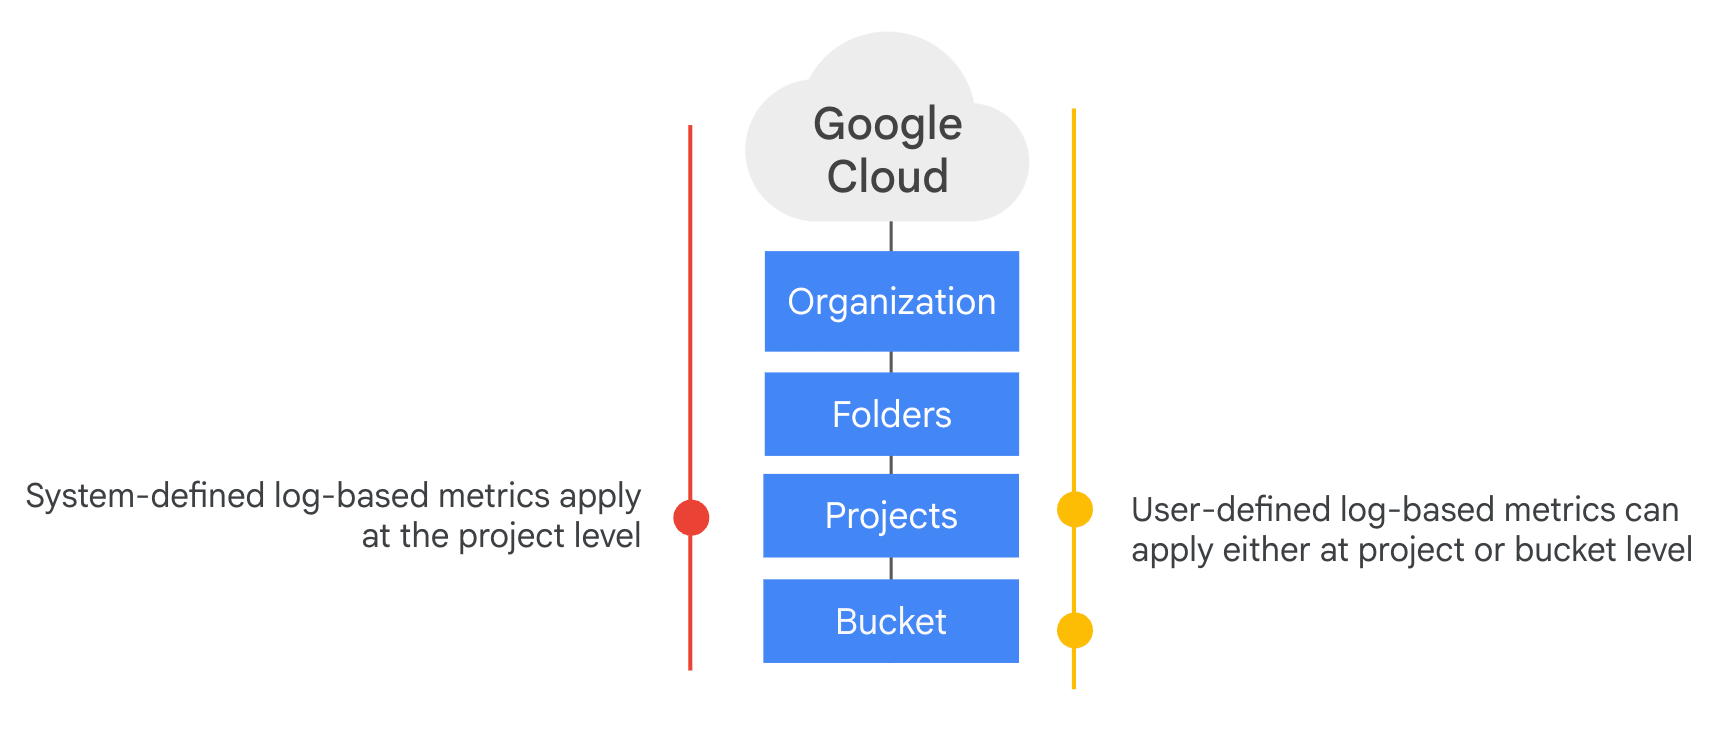
System-defined and project-level user metrics apply only to logs received in that project. Bucket-scoped user metrics apply to logs in a specific log bucket regardless of source project - the way to measure logs routed in from other projects or via an aggregated sink.
User-defined labels (extracted from a LogEntry field, optionally via a regexp) let one
metric hold many time series. But a metric supports up to 10 user-defined labels, caps at
about 30,000 active time series, and a metric cannot be removed once created. 100
resources x a 20-value label = up to 2,000 series - label with care.
Log Analytics
Log Analytics gives you BigQuery's analytical power inside the Cloud Logging console, with a UI optimized for log data. You enable it on a log bucket (an "analytics-enabled bucket"); Cloud Logging then makes that data queryable in the Log Analytics UI and in BigQuery, without you routing or managing a second copy. You can still query it with the normal Logging query language too.
With an analytics-enabled bucket the log data is managed by Cloud Logging: BigQuery ingestion/storage costs are part of your Logging bill, residency and lifecycle stay under Logging, and BigQuery sees it through a read-only view. That's different from a sink that exports a separate copy into BigQuery.
Create a bucket, choose Upgrade to use Log Analytics. You cannot later downgrade a bucket to remove it.
- DevOps - reduce MTTR: count top requests grouped by response type and severity to diagnose fast.
- Security - investigate over large volumes (e.g. all audit logs for one user over a month).
- IT / Network - network insights across GKE, VPC, and firewall logs via advanced log aggregation.
Exporting on-prem or to a SIEM
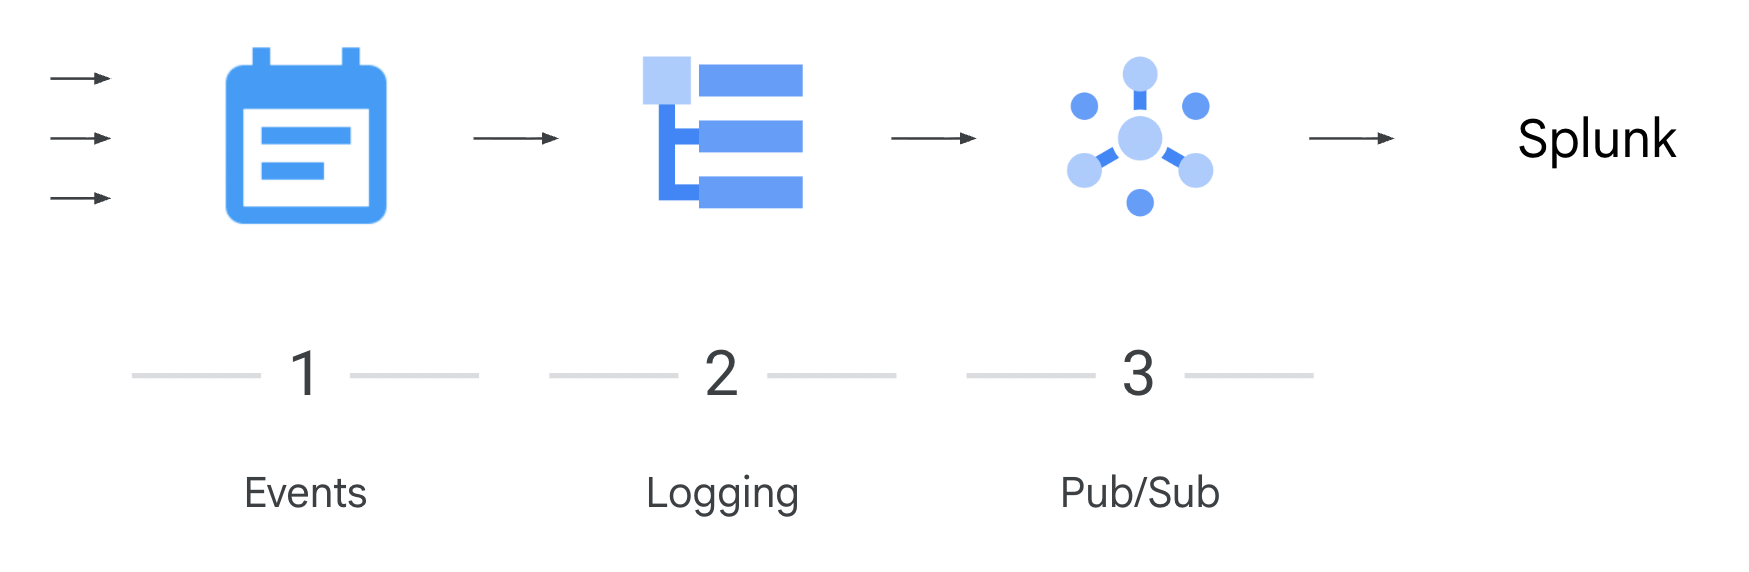
There is no direct "on-prem" sink. Route to a Pub/Sub topic and pull from your on-prem collector or Splunk/SIEM. Pub/Sub is the bridge for anything off-GCP. See Partner integrations for the full Pub/Sub to Splunk Dataflow reference architecture.