Cloud Monitoring
Monitoring collects metrics (time series), draws them on dashboards and charts, and probes public endpoints with uptime checks. The mental model: metric → dashboard/chart, and metric → condition, which the Alerting and SLOs page turns into alerting policies and notification channels.
Site reliability engineering
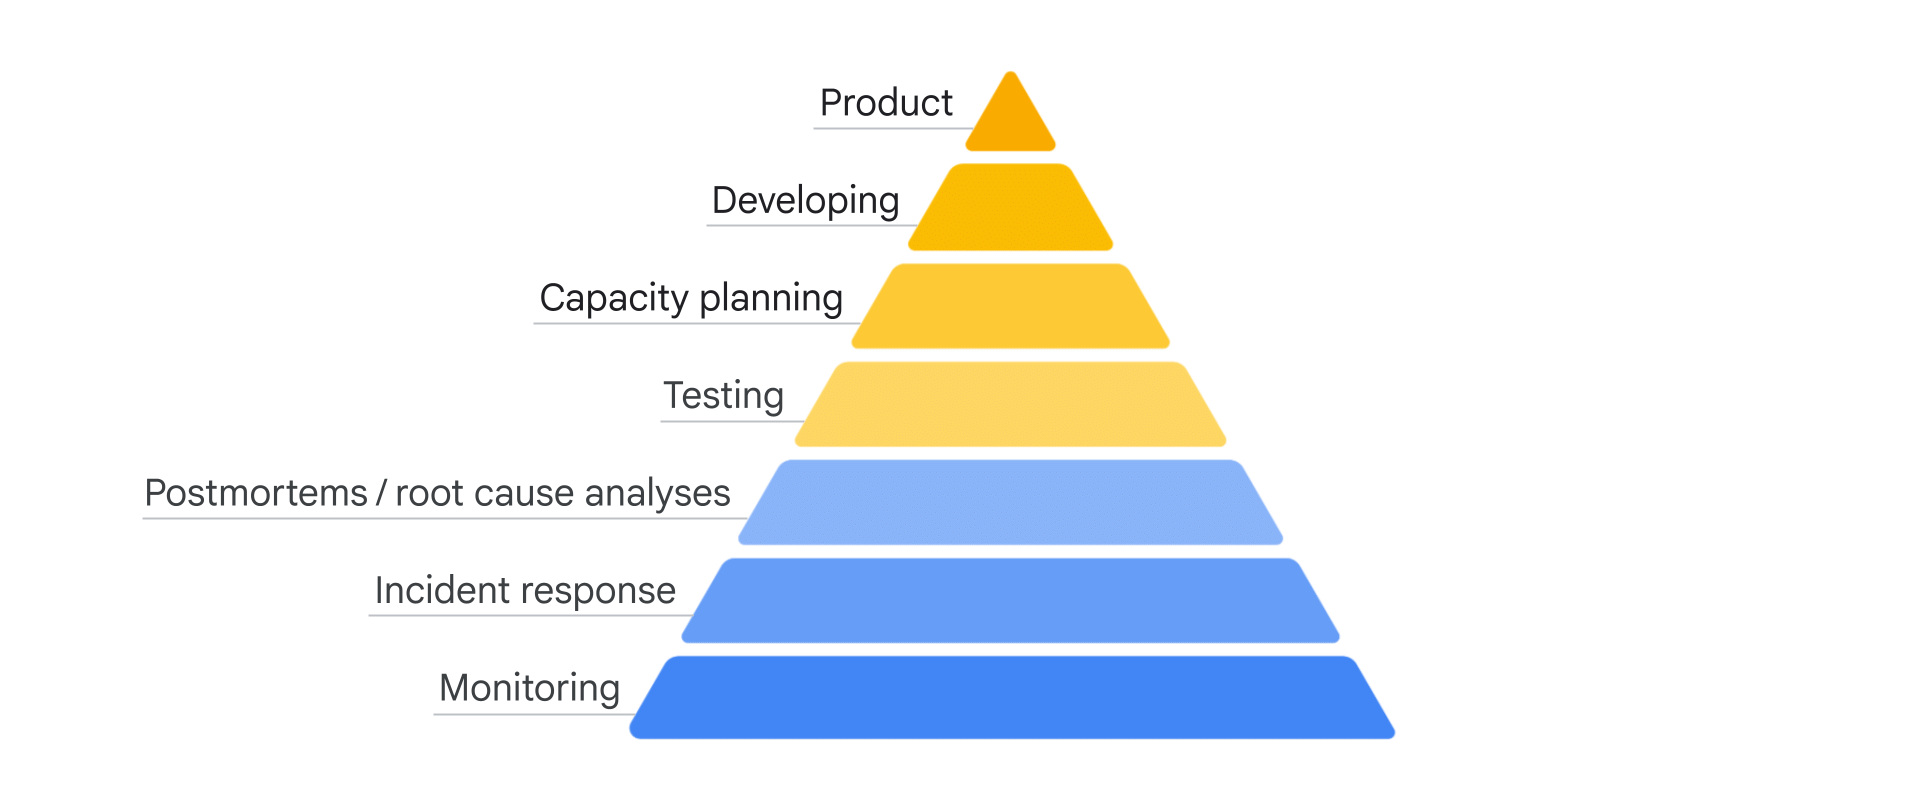
Monitoring matters to Google because it sits at the base of site reliability engineering (SRE) - the discipline of applying software-engineering practices to operations to build ultra-scalable, highly reliable systems. Everything above it in the reliability pyramid depends on being able to observe the system first.
The four golden signals
There are four golden signals that measure a system's performance and reliability. Alert on these before anything else.
- Latency - how long a request takes to return a result; directly affects user experience and can flag emerging issues. Examples: page-load latency, query duration, service response time, time to first byte.
- Traffic - how much demand is on the system. Examples: HTTP requests/second, concurrent sessions, static vs dynamic requests. Used for capacity planning and infra spend.
- Saturation - how close to capacity the service is (capacity is service-specific). Examples: % memory, % thread-pool, % cache utilization. Ties to degrading performance as it fills.
- Errors - events that measure failures. Examples: 4xx/5xx counts, failed requests, exceptions, wrong/incorrect content. May signal config, capacity, or SLO-violation issues.
Metrics
Metrics scopes
A metrics scope defines which projects a single Monitoring view can see. By default a project's scope contains only itself, but you nominate a scoping project and attach other projects to it to get one pane of glass across many projects. The scoping project is specified when you create the scope, and its name becomes the name of the metrics scope.
"View metrics for 20 projects in one dashboard" is a metrics scope with a scoping project - not 20 separate dashboards, and not copying metrics anywhere.
The metrics scope (and its Monitoring IAM roles) governs Cloud Monitoring dashboards, alerts, and uptime checks - and nothing else. Cloud Logging, Error Reporting, and the APM tools (Trace, Profiler) are strictly per-project and ignore the scope. Adding a project to a scope does not surface its logs or errors in the scoping project.
- A metrics scope holds between 1 and 375 monitored projects.
- Metric data and log entries stay in the source project - the scope only reads them.
- To monitor an AWS account, create a project to hold the AWS connector; the scope then sees AWS resources alongside your Google Cloud projects.
Everyone with access to a metrics scope can see all data in it, and a role granted on one project applies equally to every project the scope monitors. To give people different roles per project or to isolate data, put those projects in separate metrics scopes.
Organizing scopes: local or central
One scope can monitor many projects, but a project can be monitored by only one scope, so you choose the relationship that fits your organization.
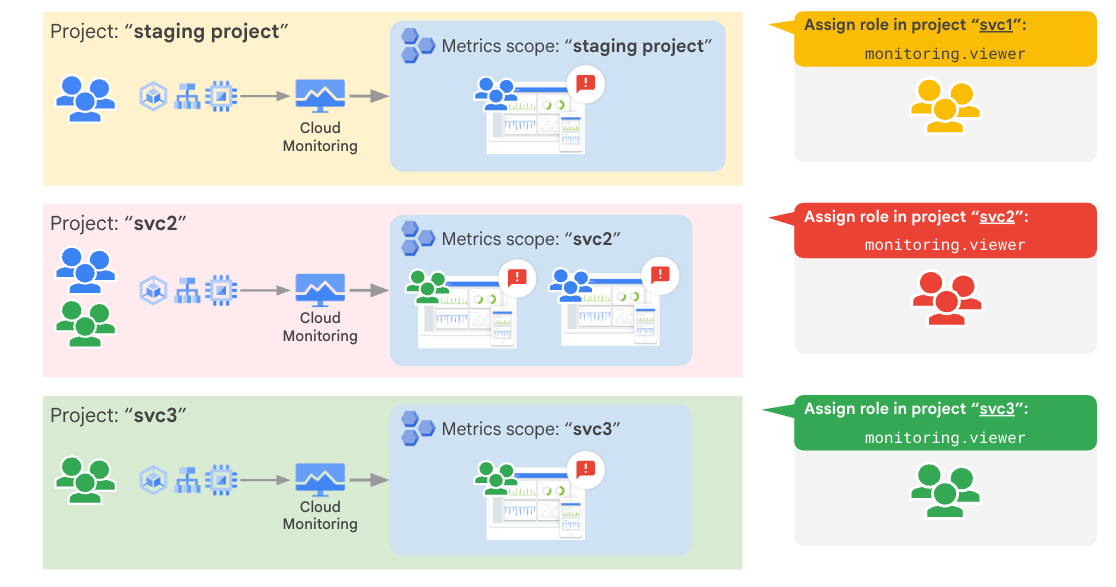
Option 1 - monitor each project locally. Each project keeps its own scope and its own
monitoring config, and you grant monitoring.viewer per project. This gives clear per-project
separation, makes it easy to give dev teams access, and makes monitoring a standard,
automatable part of project setup - but you get limited visibility once an app spans several
projects.
Option 2 - one central scope for large units of projects. A single scoping project's scope is expanded to pull in many projects, so one dashboard or alerting policy can span all of them. This gives a single pane of glass across related projects and easy non-prod vs prod comparison - but anyone with Monitoring IAM sees every environment, so per-team separation is lost.
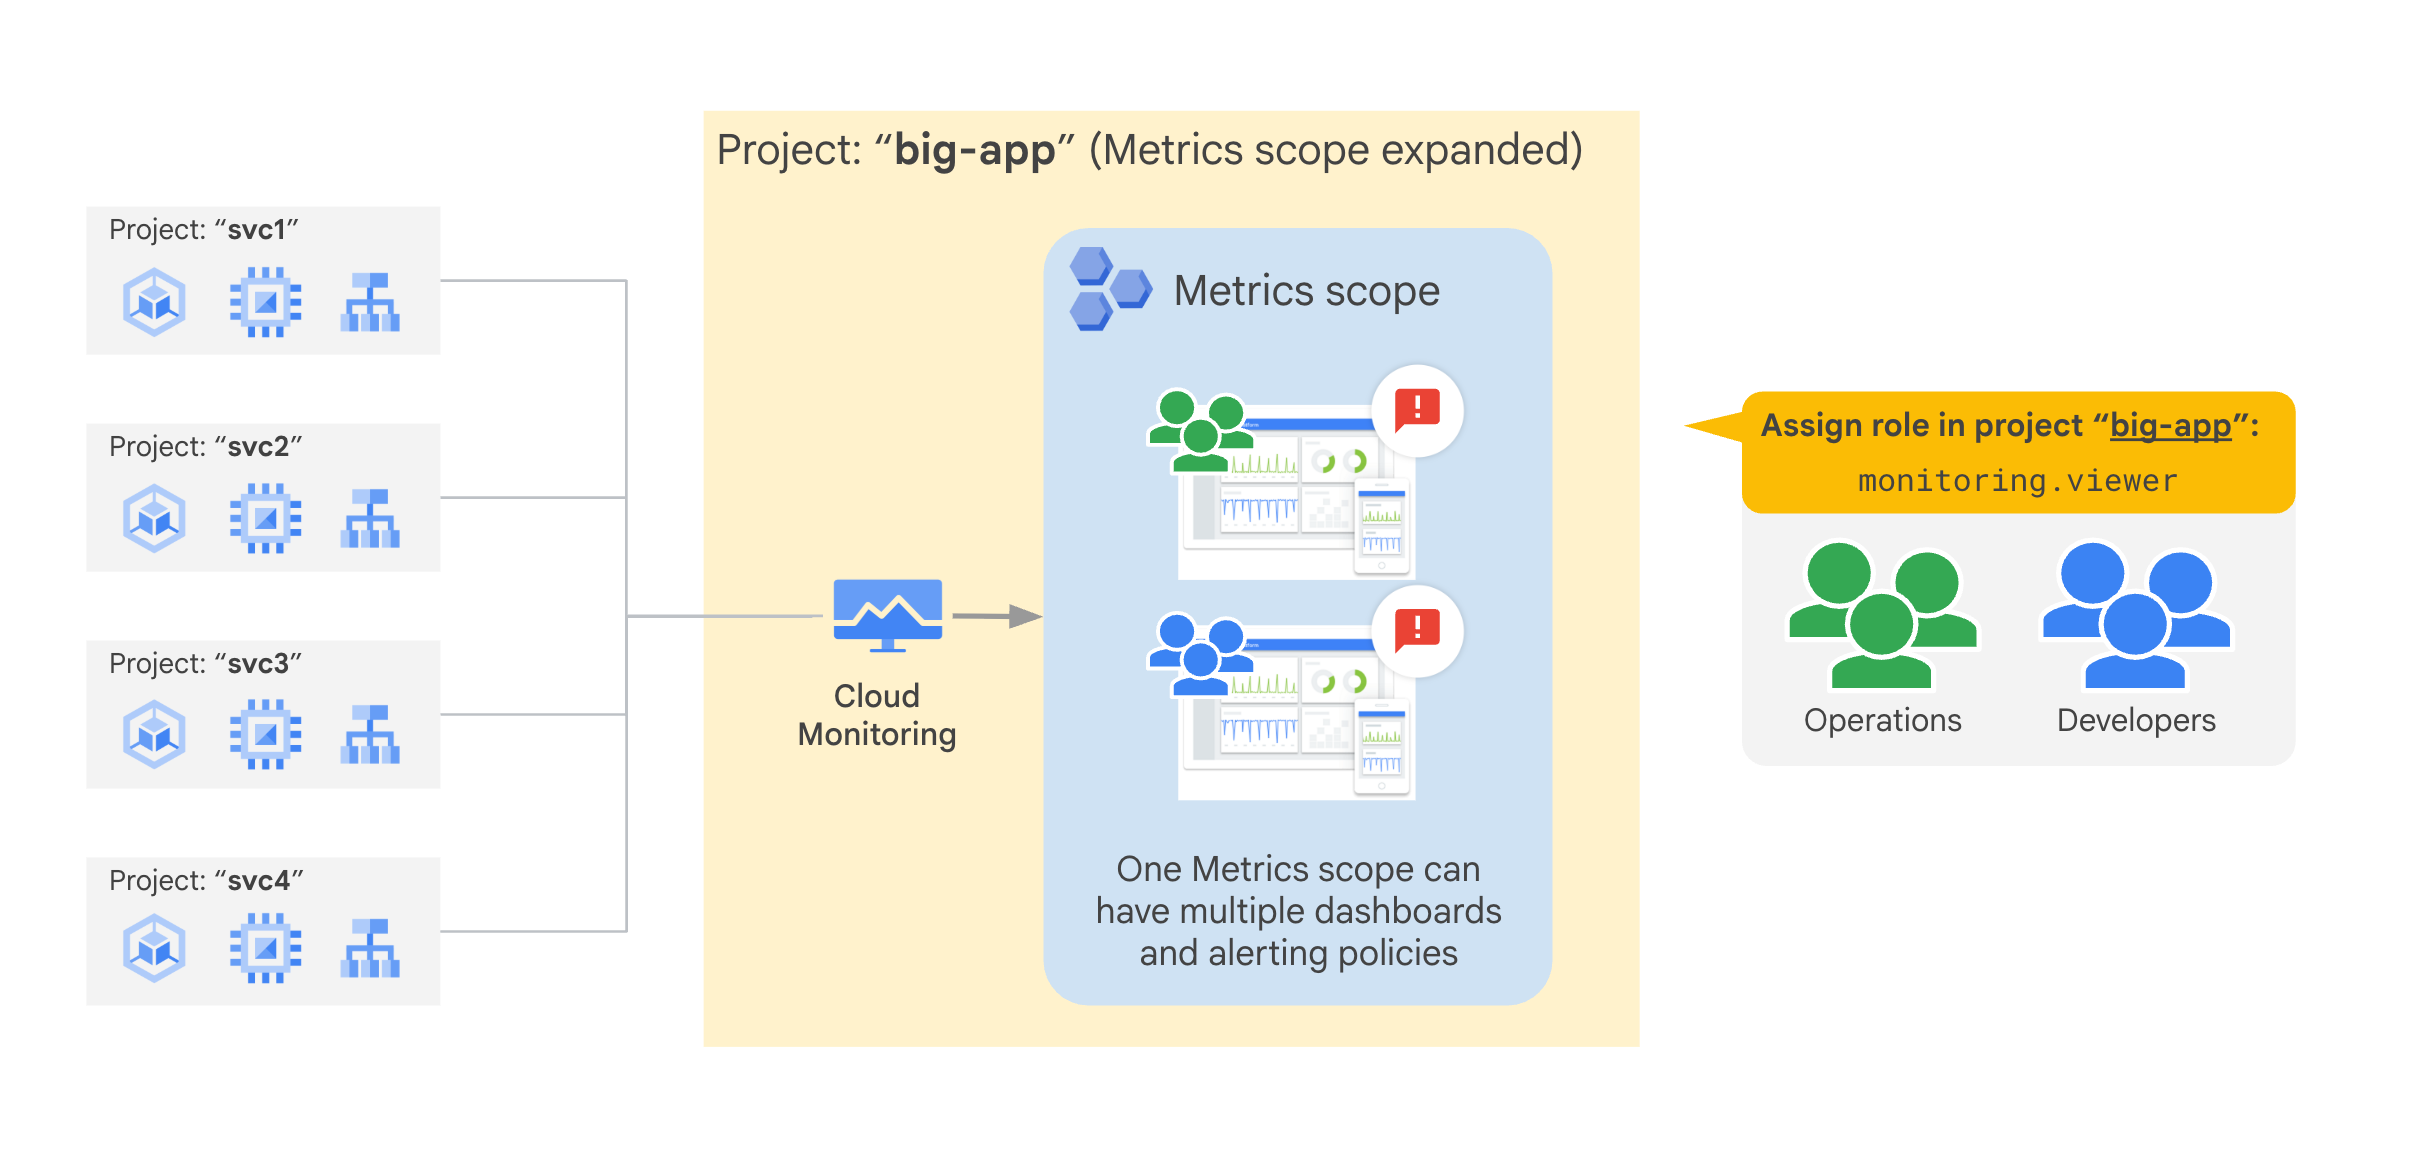
The recommended pattern is a dedicated project whose only job is to host the monitoring config, with its metrics scope pulling in the projects that hold the real resources. If one of those resource projects is later deleted, the monitoring config for all the others is unaffected - which would not be true if a real workload project were the scoping project.
Custom metrics and Managed Prometheus
- Custom metrics - your app writes application-specific values via the Monitoring API
(e.g.
custom.googleapis.com/...). - Google Cloud Managed Service for Prometheus - the managed, autoscaling way to ingest Prometheus metrics (especially from GKE) without running your own Prometheus servers. Query with PromQL; the answer for "Prometheus at scale on GCP."
When the standard metrics don't fit, a custom metric can pass a value only your app knows - for example, a game server's current player count, which is a far better scaling signal than CPU or network load.
Querying with PromQL
PromQL (Prometheus Query Language) is an alternative to the menu-driven Metrics Explorer for querying and charting Monitoring data. It's the industry-standard query language from Prometheus, so it reuses that ecosystem (Grafana, Alertmanager).
You can query with PromQL over: Google Cloud system metrics, user-defined and log-based metrics, and Managed Service for Prometheus. Tools like Grafana can chart the results.
The bare metric compute_googleapis_com:instance_cpu_utilization{monitored_resource="gce_instance"}
charts one line per VM; wrap it in avg(...) for the fleet average.
PromQL is the modern default, but existing MQL dashboards and alerts keep working and you can still create new ones via the Monitoring API. Don't migrate MQL just because PromQL exists.
Autoscaling on a metric
A managed instance group can autoscale to hold a metric at a utilization target: the autoscaler adds VMs when the value is above target and removes them when it is below.
Data model
Monitoring data is recorded as time series. Every time series has the same four-part structure, regardless of what it measures.
- metric - the metric type (a.k.a. metric descriptor, e.g.
logging.googleapis.com/log_entry_count) plus metric labels (one combination of label values). The type defines the available labels and what a data point means. - resource - the specific monitored resource the data came from (e.g. a
gce_instancewith its instance and project IDs) plus its resource labels. - metricKind + valueType - how to interpret the values.
valueTypeis the data type (e.g.INT64,DOUBLE,BOOL,DISTRIBUTION).metricKindis one of GAUGE, DELTA, or CUMULATIVE. - points - an array of timestamped values. Most series have many; the metric type says what they represent.
- GAUGE - the value measured at that instant (current CPU %, current memory).
- DELTA - the change over the time interval (requests in the last minute).
- CUMULATIVE - a value that accumulates and only grows, measured against a start time (total requests since process start). Picking the wrong kind makes the chart math meaningless.
Dashboards and exploration
Dashboards and charts
A dashboard is a saved collection of charts. Each chart picks a resource type (e.g. GCE VM instance) and a metric (e.g. CPU utilization), and can narrow the data with a filter on resource or metadata labels - no filter means every matching instance is shown. View options control how the chart draws: color mode, X-Ray mode, and stats mode.
Metrics Explorer
Metrics Explorer lets you examine any resource + metric ad-hoc, without adding a chart to a dashboard. Use it to poke at a metric quickly; use a dashboard chart when you want the view to persist.
Metrics Explorer is for one-off exploration - close the tab and it's gone. To keep a view around, add the chart to a dashboard.
A chart needs at least a resource type + metric type pair. From there, a filter removes time series that don't match (by resource group, name, resource label, or metric label) for fewer lines and better signal-to-noise. Grouping then combines series by label values using a function (sum, mean, ...) into a new series. Finally, alignment regularizes raw data into equal time buckets (the alignment period) using an alignment function (sum, mean, ...), so multiple series can be combined. Alignment is a prerequisite for aggregation; Monitoring does it automatically with defaults, and the default (and minimum) alignment period is 1 minute.
You can't aggregate two time series until they're aligned to the same buckets. Monitoring aligns automatically with a 1-minute default; you only touch alignment function/period when the default hides what you need.
Resource groups
A group collects resources by a rule (name contains a string, or a label match) so you can watch or target them together. Membership is dynamic: any resource matching the rule joins automatically. A group is then a reusable target - a dashboard, alerting policy, or uptime check can point at the whole group instead of one instance.
Naming an instance group nginx and grouping on "name contains nginx" auto-includes all
three nginx VMs, and any future one. You don't add members manually.
Uptime checks
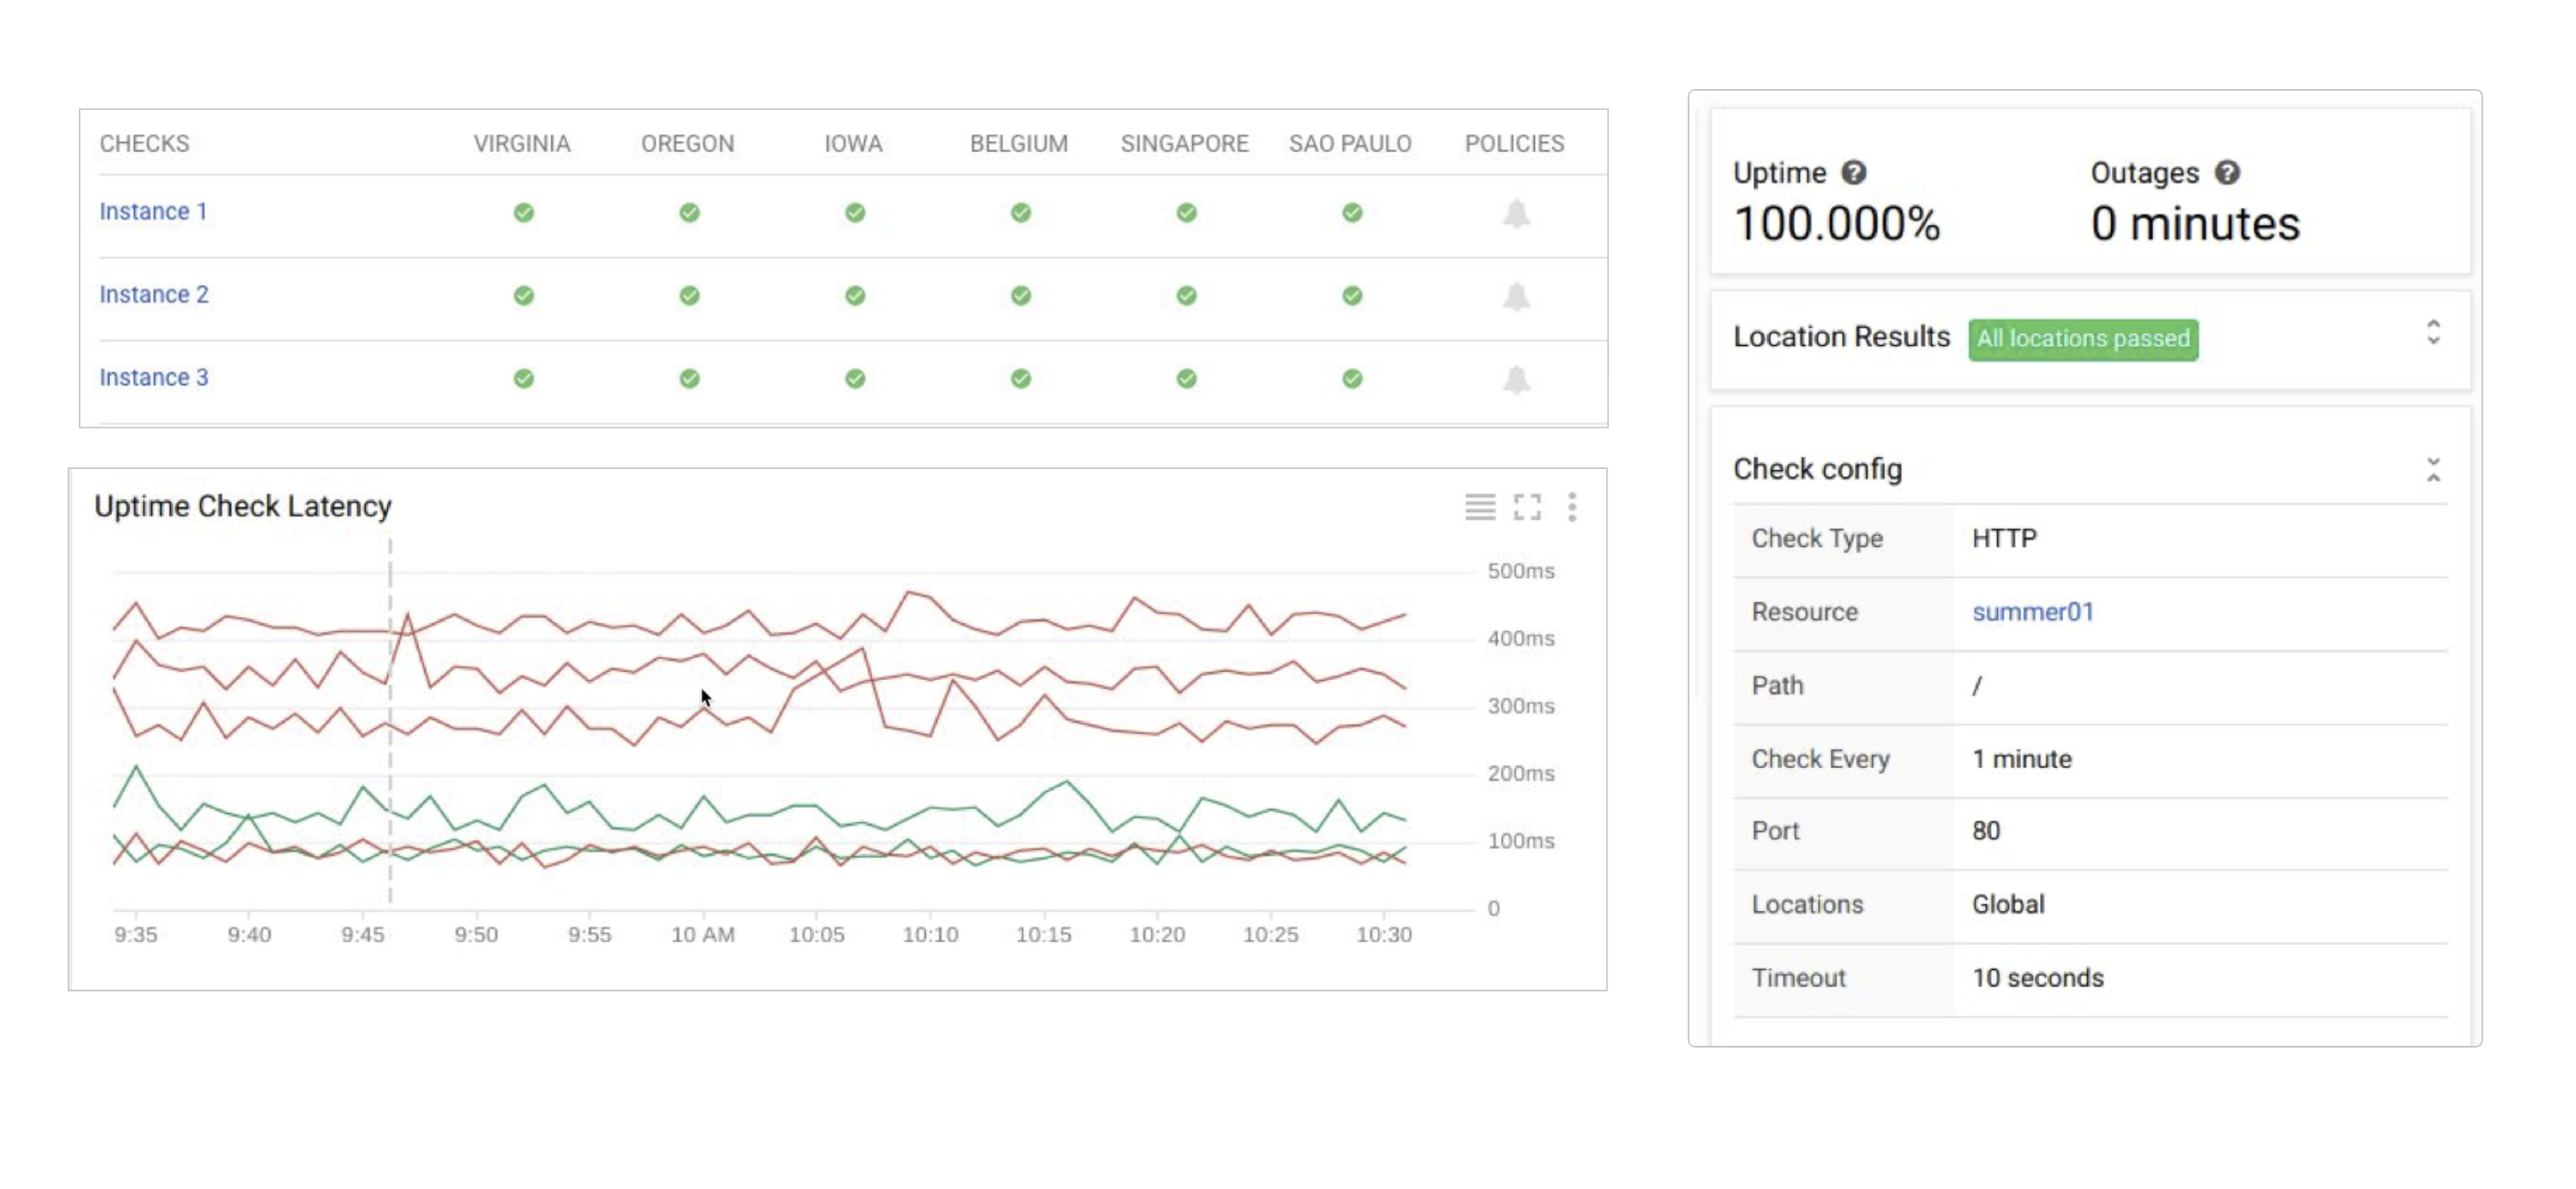
An uptime check pings an HTTP/HTTPS/TCP endpoint from multiple global locations and alerts on failure or latency. It can target a single resource or a whole resource group, and check on an interval (e.g. every minute). Pairs with an alerting policy for "site is down" paging.
- Type: HTTP, HTTPS, or TCP.
- Target: an App Engine app, a Compute Engine instance, a URL of a host, or an AWS instance or load balancer.
- Runs from multiple global locations; you can view per-location latency and attach an alerting policy.
- No response within the timeout (e.g. 10 seconds) counts as a failure.
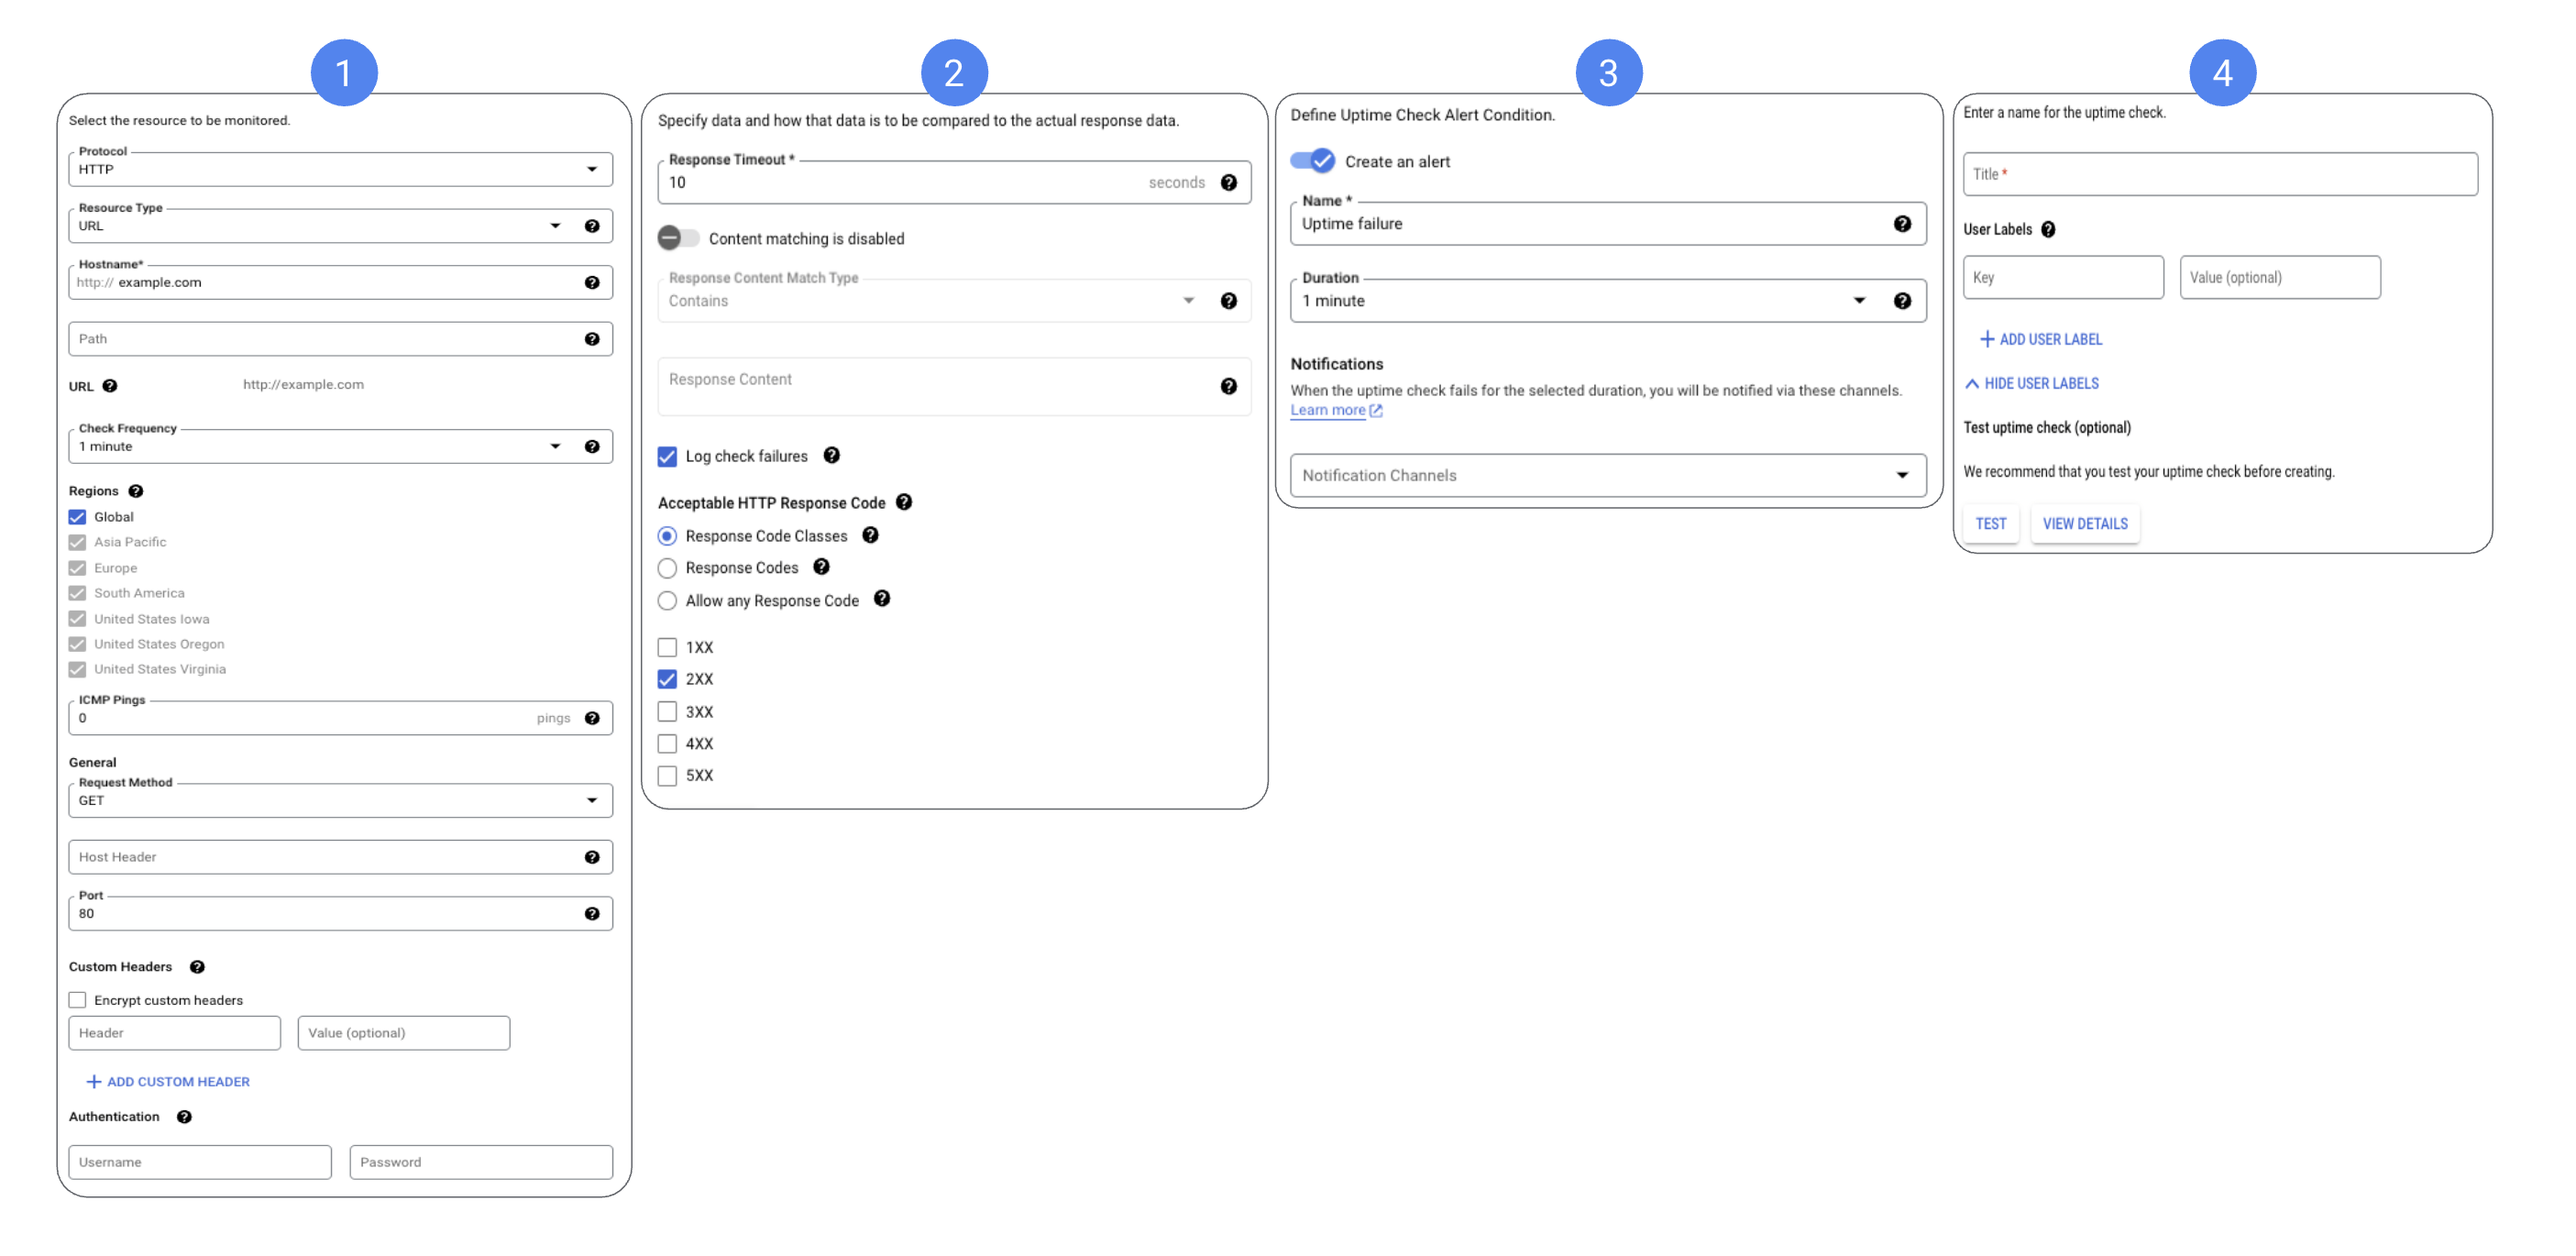
You create a check through a four-step wizard - target, response validation, an optional alert, then name and test:
Once it is running, the check dashboard shows each target passing from every location, the uptime % and outage minutes, and the check config (type, resource, path, interval, port, locations, timeout):
Uptime checks come from Google's probers, so the target must be publicly reachable (or use private uptime checks inside the VPC). A purely internal service with no ingress can't be probed the normal way.
Collecting from VMs
The Ops Agent
VM guest OS metrics (memory, disk, per-process) and application logs are NOT collected by default. You must install the Ops Agent on the VM - it replaces the older separate Monitoring and Logging agents with one unified agent. The hypervisor runs below the VM and can't see inside it, which is why guest metrics like memory have to come from an agent running in the VM.
The Ops Agent is the primary agent for collecting telemetry from Compute Engine. It can also be configured to monitor many third-party applications, and it runs on the major operating systems - CentOS, Ubuntu, and Windows among them.
Compute Engine gives you CPU, network, and disk throughput out of the box, but memory utilization and disk space need the Ops Agent. "I can't see RAM usage on my VM" = agent not installed.
Recap
- Core Google Cloud service metrics (Compute Engine, GKE, Cloud Storage, BigQuery, Cloud SQL) and Ops Agent metrics retained 24 months.
- Other Google Cloud metrics, AWS/external metrics, and log-based metrics retained 6 weeks.
- Managed Prometheus / custom / external metric retention up to 24 months (kept at full resolution for 6 weeks, then down-sampled to 10-minute intervals).